

Ten Hypotheses Generated for Increasing Survey Response Propensity Among Immigrants and Inhabitants of Socially Disadvantaged Areas
Theorin, N. & Lundmark, S. (2024). Ten Hypotheses Generated for Increasing Survey Response Propensity Among Immigrants and Inhabitants of Socially Disadvantaged Areas. Survey Methods: Insights from the Field. Retrieved from https://surveyinsights.org/?p=19154. The replication data, analysis syntax, preregistration & questionnaires are available for reuse at https://osf.io/8nfcd/ (OSF).
© the authors 2024. This work is licensed under a Creative Commons Attribution 4.0 International License (CC BY 4.0) 
Abstract
In democracies, surveys play a key role in policy decision-making. That immigrants and people living in socially disadvantaged areas are especially unlikely to participate in surveys might, therefore, lead to their opinions not being considered to the same extent as those of others. However, the mechanisms for nonresponse among these groups are relatively unknown, even though they currently make up a significant proportion of the population in many Western societies. In this manuscript, the mechanism of nonresponse is explored through an exploratory and a confirmatory phase. In the exploratory phase, nine focus group interviews were conducted, and two novel and eight existing hypotheses on what causes nonresponse were generated. In the confirmation phase, one of the novel hypotheses was assessed and found not to be supported: increased internal political efficacy did not increase response propensities among immigrants, persons living in socially impoverished areas, or the general population. Researchers are encouraged to assess the remaining generated hypotheses.
Keywords
Immigration, Internal political efficacy, Nonresponse, Socially disadvantaged areas, Survey self-efficacy
Acknowledgement
The authors would like to direct thanks to Jessica Lundberg at the Swedish Police for facilitating the confirmation phase study. This study was funded by the Swedish Research Council grant number 2018-01314. The funders did not have a controlling interest in any aspects of the data collection, analyses, or the decision to publish.
Copyright
© the authors 2024. This work is licensed under a Creative Commons Attribution 4.0 International License (CC BY 4.0)
Introduction
Surveys have increasingly been plagued by individuals’ decreased willingness to participate in surveys (i.e., low response propensity) (Groves, 2006; Williams & Brick, 2018). Fewer completed surveys increase the risk of biased point estimates, correlations, and generalizability of findings (Abraham, Maitland, & Bianchi 2006; Couper & de Leeuw, 2015). Weaker generalizability leads to misperceptions about reality and/or public opinion, and consequently, to poorly informed policy decision-making (Groves, 2006).
In previous studies, immigrants and individuals living in socially disadvantaged areas (areas characterized by widespread organized crime, distrust in the authorities, and low willingness to collaborate with law enforcement) have been identified as especially unlikely to participate in surveys (Shaghaghi, Bhopal, & Sheikk, 2011; van Wees et al., 2019). Furthermore, a meta-analysis of survey data in Sweden found that immigrants and young adults were among the least likely to complete mixed-mode questionnaires and that—despite controlling for several individual demographic attributes—people living in socially impoverished areas were also less likely to do so (Lundmark & Backström, 2023). It seems likely that sharing several of such demographic attributes may exacerbate the likelihood of not participating in surveys even further.
The nonresponse of such groups may be even more worrisome for survey research given the recent rapid growth of the population having such characteristics in Western countries. For example, the population of Sweden went from 11.8% of the inhabitants being foreign-born in 2000 to 20% foreign-born in 2021 (Statistics Sweden, 2022). Increasing the response propensity among such groups may, therefore, be particularly effective in halting the increasing nonresponse bias found in Western societies.
However, to date, suggestions of the potential causes of the low response propensities among immigrants and groups in socially disadvantaged neighborhoods have remained relatively idle. Only a few studies have focused on conceiving potential mechanisms behind the lower response propensity among these groups, suggesting a need for a resurgence of new ideas for mechanisms of response propensities (Bates, 2017; Vahabi et al., 2015). Specifically, calls have been made for hypotheses-generating research where respondents “introspect” over their unwillingness to complete surveys (Singer, 2011). Allowing respondents to discuss their reasons for not participating in surveys may provide fertile ground for the generation of hypotheses of the mechanisms behind response propensities among the general public, and among harder-to-reach groups specifically.
To remedy the stagnation of hypotheses generation of the mechanisms behind response propensities among immigrants and individuals living in socially disadvantaged areas, this manuscript presents the results of nine focus group interviews. These interviews resulted in the generation of ten hypotheses, two of which were novel in the published literature. Based on the findings of the focus group interviews, a second study testing one of the novel hypotheses was administered to a probability sample of socially disadvantaged and not socially disadvantaged areas in Sweden.
Proposed Explanations for Survey Nonresponse among Immigrants and Socially Disadvantaged Areas
The declining response propensities of surveys in the decades prior and after the new millennia led to a growing body of literature that focused on factors associated with survey nonresponse. However, such research has tended to be descriptive rather than explanatory, with a strong focus on how socio-demographic factors relate to survey nonresponse. In such descriptive inquiries, educational attainment (Keeter et al., 2006; van Wees et al., 2019) and age (Bates, 2017; Shaghaghi et al., 2011) stand out as one of the strongest predictors of nonresponse. However, three other demographic groups have also been identified as particularly unlikely to participate in surveys: ethnic minorities, immigrants, and inhabitants of economically/socially disadvantaged areas (Bates, 2017; Bates et al., 2019; Couper & de Leeuw, 2015; Lundmark & Backström, 2023; Shaghaghi et al., 2011; van Wees et al., 2019). That immigrant background is negatively related to response propensity may be of particular importance for European and North American countries, which all saw high rates of immigration between the 1990s and 2020s. In Sweden, in addition to doubling the proportion of the foreign-born population between 2000 and 2021, many Swedes were in 2021 identified as living in socially disadvantaged areas, making up a total of 5% of the entire population. This creates a setup for a double curse of fostering low response propensity as areas identified as disadvantaged hold a population overrepresented by individuals with an immigrant background (Statistics Sweden, 2018).
Some mechanisms of nonresponse in such groups have been suggested. For example, distrust of public institutions has been considered an explanatory factor of low response propensities among immigrants and individuals living in disadvantaged neighborhoods (Couper & de Leeuw, 2015; Vahabi et al., 2015; Nápoles-Springer et al., 2004; Yancey, Ortega, & Kumanyika, 2006). A lack of social integration has also been proposed as a leading influence for nonresponse, perhaps leading to a fear of mistreatment and exploitation of the data provided (Abraham et al., 2006; Bates, 2017). For instance, research has identified that such individuals were concerned with data being collected to benefit the personal careers of researchers rather than being for the good of the community or that data would be collected to portray the surveyed community unfavorably (Yancey et al., 2006). Unfortunately, most of the studies on distrust as a mechanism of nonresponse have been conducted among the U.S. Black population. Therefore, the lack of trust found in previous studies may partly be explained by the U.S.’s history of slavery and racial discrimination (Nápelos-Springer et al., 2004). It remains unclear to what extent distrust as a mechanism for nonresponse can be generalized to other countries and minority groups.
Furthermore, economically disadvantaged people and people who fear confrontation with legal authorities have been found less likely to participate in surveys (Abraham et al., 2006; Bates & Mulry, 2011). However, to the best of our knowledge, it has not yet been studied whether immigrants and inhabitants of disadvantaged areas tend to be overrepresented in the groups who fear confrontation with legal authorities. Research from the U.S. has found that being an ethnic minority, such as having a Black African/American or Hispanic background, lower education, and unemployment rates tended to coincide with fear of confrontation and with living in more disadvantaged areas (Bates & Mulry, 2011). Consequently, it may be likely that disadvantaged areas and immigrants in non-U.S. contexts show similar patterns of participation in surveys. Lastly, a wide range of studies have identified language barriers as a crucial explanation for nonresponse among immigrants (e.g., Bates, 2017; Brick & Williams, 2013).
A theory of survey response suggests that a respondent needs to believe that the benefits of completing a questionnaire will outweigh the costs of completing it (Dillman et al., 2014, p. 25). To increase the perceived benefit, theories such as the leverage-saliency theory of survey response (e.g., Groves et al., 2000; Groves & Heeringa, 2006) suggest that any survey request hold several attributes (e.g., the topic of the questions, design of the questionnaire, the sender of the request, what data will be used for). Furthermore, the relevance of these attributes is thought to vary for groups of respondents, and highlighting some attributes may increase response propensity for some while decreasing it for others. To that end, tailoring the survey request for different groups of respondents (Dillman et al., 2014; Dillman, 2020; Lynn, 2014; Tourangeau et al., 2017) as well as tailoring refusal conversion attempts toward the hard-to-reach groups has been suggested (e.g., Stoop, 2004; Stoop et al., 2010, chapter 7). A tailored request can entail offering different groups of respondents varying amounts of monetary incentives (Singer & Ye 2013), asking questions that hard-to-reach groups will find interesting (see Singer 2011), targeting the survey invite to the group (Christensen et al., 2019), targeting the reminder to the group (Stoop et al., 2010, chapter 7), or offering a respondent’s preferred mode for completing the interview (see de Leeuw, 2018, for an overview). However, to tailor the survey attributes to increase response propensities, survey researchers need to acquire a good understanding of which survey attributes are important for the different groups of respondents and how these attributes should be used for nudging them toward survey participation.
Exploring nonresponse among immigrants and individuals living in socially impoverished areas should increase the ability of future survey researchers to successfully tailor survey requests optimizing response propensities of hard-to-reach groups. Furthermore, assessing the generalizability of the mechanisms behind nonresponse uncovered among hard-to-reach subgroups in North America to European contexts (e.g., Abraham et al., 2006; Bates, 2017; Couper & de Leeuw, 2015; Vahabi et al., 2015; Nápoles-Springer et al., 2004; Yancey, Ortega, & Kumanyika, 2006), and undertaking a theory-generating approach on the causes of nonresponse of hard-to-reach subgroups in Europe, may provide insights on how to combat nonresponse bias in surveys. The present manuscript attempts to shed light on nonresponse through respondents’ introspection of their nonresponse behavior.
Exploratory Phase: Focus Group Interviews
Method
To generate hypotheses of nonresponse among immigrants and inhabitants of socially disadvantaged areas, nine focus groups were conducted in February 2020. Focus groups have been found especially apt for understanding the behavior and perceptions of specific groups (Ekström, 2010; Morgan & Krueger, 1993), as well as for generating new ideas and developing hypotheses of such behavior or perceptions (Breen, 2006). Compared to individual interviews and other group interviews, focus group interviews encourage interaction between participants rather than between the participants and the moderator. Encouraging interaction is thought to allow the participants less aware of their perceptions and behavior to, by contrasting and comparing their thoughts to those expressed by other participants, also become able to elicit their own perceptions (Morgan & Krueger, 1993). The group interaction in focus groups is also suggested as fitting when interviewing individuals belonging to groups with limited power, influence, and language skills (Barron et al., 2010; Morgan & Krueger, 1993). In addition, compared to individual in-depth interviews focusing on a specific individual’s experiences, focus groups may be appropriate when a breadth of generated hypotheses is sought rather than an understanding of a specific individual behavior (Crabtree et al., 1993). Given that the purpose was to generate hypotheses from the experiences, behavior, and perceptions of survey participation among disadvantaged and minority groups, focus groups were deemed more appropriate than in-depth individual interviews.
The recruitment and the interviews were conducted in Biskopsgården, a residential area in Gothenburg, Sweden, identified by the Swedish Police as extremely socially disadvantaged (Polisen, 2021). To be identified as a socially disadvantaged area by the Swedish police, the area had to have a high crime rate with widespread organized crime and where inhabitants showed great distrust in the police. At the time of the interviews, 60% of Biskopsgården’s residents were immigrants (Göteborgs Stad, 2022). Biskopsgården was chosen as the venue for recruitment to increase the chances of finding individuals residing in socially impoverished areas and who were immigrants (i.e., socio-demographic factors linked to nonresponse). Immigrants were defined as individuals not born in Sweden and who have since taken up residence in Sweden. Recruiting individuals who had one or both of these demographic attributes increased the chances of finding individuals who were likely especially hard-to-reach in surveys but still recruitable for focus group interviews. In addition, before being recruited, participants were asked if they typically agreed to answer surveys to which most answered no. All participants knew what a survey was, which should facilitate a fruitful discussion, but may limit the hypothesis generation to individuals who have at least some knowledge of surveys. To increase the likelihood of theoretical saturation, we allowed individuals who possessed just one or both of the demographic attributes to be recruited.
The interviews centered around reasons for nonresponse and self-experienced low willingness to participate in surveys. Each interview consisted of three to six individuals. Participants in three of the nine focus groups were recruited via the Swedish national language education course Swedish for Immigrants (SFI) in Biskopsgården. SFI is a voluntary language course offered by the Swedish state and for which all recent immigrants from non-Nordic countries are invited to participate (provided they have a Swedish social security number). In the language course, participants are taught basic Swedish at a level of making it through everyday life in Sweden. Participants enrolled at SFI come from a diverse set of immigrant backgrounds and many have only an elementary education from other countries. The other six focus group participants were recruited at the cultural center/library or in the main square of Biskopsgården. Across all nine focus groups, only 24% had studied at a college or university.
All interviews were conducted in a room at the library/cultural center and were conducted in Swedish, using a semi-structured interview guide designed to tap the perceptions and experiences of surveys. All participants were sufficiently proficient in Swedish to approximate fluent conversation. The full transcripts, the exit questionnaire, and the interview guide can be found at osf.io/8nfcd/.
Sample
The nine focus groups comprised 33 participants with a majority of young, low-educated, and immigrant participants (for exact demographic composition, see Supplementary Online Materials, SOM, Table S1). Within each group, there was homogeneity in terms of age, language skills, and being an immigrant or not. Homogeneity within groups is preferable for establishing hypotheses-generating interaction and dynamics (see Grønkjær et al., 2011). Our recruitment was not aimed specifically toward young adults. However. given that young adults have been identified as likely nonrespondents (e.g., Lundmark & Backström, 2023), interviewing young adults should have increased the likelihood of having recruited low response propensity participants, and doing so allowed us to identify several hypotheses relating to young immigrants and young individuals living in socially disadvantaged neighborhoods.
Procedure
First, participants were welcomed, the intended focus group process was explained, were informed that their participation was voluntary and anonymous, and that the interviews would be audio recorded but that the recording would be deleted after transcription. Participants were also informed they could exit the interview at any time and would be compensated regardless of completing the interview or not. The interviews lasted 20 to 40 minutes and were transcribed in as much detail as possible to provide a text that was true to the original. Minor changes (grammatical corrections and minor clarifications) were made in cases where it was considered necessary to facilitate reading.
Analysis
The interviews were analyzed following Braun and Clarke’s (2006) step-by-step guide to thematic analysis, a method for identifying, analyzing, and reporting themes within data. An intercoder reliability test was conducted by an external coder with experience in conducting focus groups but without experience in survey methodology (e.g., Wibeck, 2010). Ten percent of the material was randomly selected and then categorized under the themes based on the definitions of each theme. The test had an agreement rate of 72.7%. The majority of the errors were related to subthemes 2.3. and 2.4. The description of these subthemes was clarified to resolve the discrepancies between the two coders. At the final step of the thematic analysis, vivid quotes/dialogues were selected to represent each theme and were included in the results section. Each step of the thematic analysis is detailed in SOM, section S1.
Results
Overview of the Themes
The analysis resulted in a thematic map with three main themes with a total of eight subthemes (see Table 1). Quotes supporting each of the themes can be found in SOM, section S2.
Main Theme 1: Perceptions of Societal Factors
A main theme that participants elaborated on was how societal factors may explain why they choose not to participate in surveys. Within this theme, two subthemes were identified.
Subtheme 1.1. Opportunity to Exert Influence – Responsiveness by Society. The most prominent subtheme, appearing in each interview, was the need for an opportunity to exert influence and responsiveness by society. Arguments within this theme were often long and developed, and participants frequently returned to this subtheme during the interview. In particular, the participants projected a strong willingness to influence issues in their own residential area. However, they also expressed that they believed their possibilities to influence things were limited and that those asking them questions were likely not going to listen to their individual beliefs or suggestions anyway. Participants described this lack of responsiveness and the limited opportunities to influence as key reasons for not participating in surveys.
Table 1
Main Themes and Subthemes Regarding Factors That Might Influence the Likelihood of Participating in Surveys
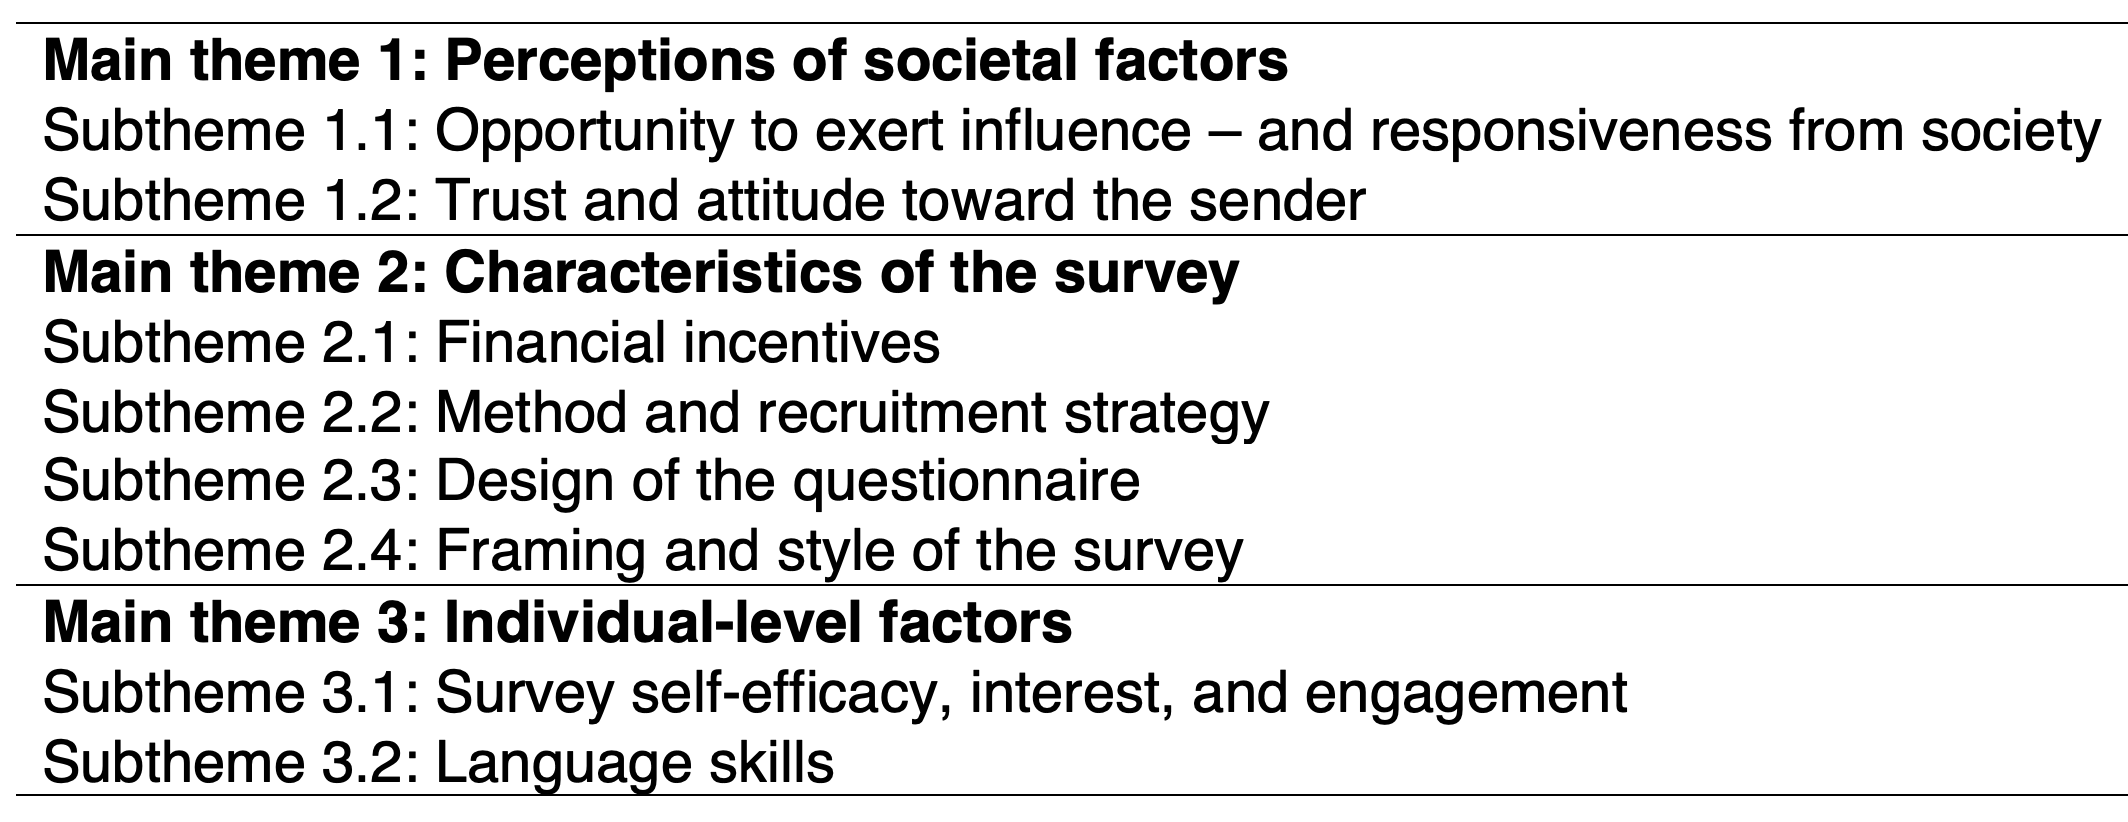
Note: Themes are presented in no particular order.
Subtheme 1.2. Trust and Attitude Toward the Sender. Participants also discussed whether it was possible to trust people and organizations, and that this distrust caused them to not participate in surveys or when government officials approached them. Participants who said they trusted people in general or that they trusted most authorities expressed that trust may be important for them and others when deciding to complete a survey. Similarly, if they felt aversion or disliked the sender of the survey, they said they would not answer. Several of the youngest participants mentioned that they would be unlikely to respond to a survey by the police because of their deep aversion toward the police in their neighborhood.
Main Theme 2: Characteristics of the Survey
In the second main theme, different characteristics of the survey were identified as influencing response propensity across four subthemes.
Subtheme 2.1. Financial Incentives. Participants often discussed the importance of direct rewards–such as money or gift cards–for participating in surveys. However, not all focus group participants felt that incentives were a prerequisite for participation. For instance, one participant expressed that the opportunity to influence policy was a stronger mechanism for participation than financial incentives.
Subtheme 2.2. Method and Recruitment Strategy. Moreover, participants tended to discuss the pros and cons of different survey modes. Whereas some participants argued they would be more likely to participate if receiving a paper-and-pencil questionnaire, others—often younger participants—said they preferred online questionnaires. Participants also exuded positivity toward face-to-face interviews, and none had anything negative to say about that mode. Furthermore, participants elaborated on how innovative recruitment strategies would increase their response propensity, such as asking them to participate while queuing at the migration agency.
Subtheme 2.3. Design of the Questionnaire. Participants also discussed technical aspects of the survey mattering for their not responding, such as the amount of information in the invitation, the length of the survey, and the design of the survey questions (e.g., open-ended questions vs. fixed response options). One prominent view was that a lengthy survey would negatively affect willingness to participate. Lastly, some participants said they preferred being offered response options over being asked open-ended questions since preset options would require less effort to answer.
Subtheme 2.4. Framing and Style of the Survey. The participants discussed how the style of the text in a survey and the visual aspects affected their first impression of the survey. Under this subtheme, many participants mentioned that it could be off-putting if the survey looked formal and that simple language would be beneficial, especially for immigrants. Whereas many participants agreed that less formal language would encourage participation, others expressed wanting more color, figures, slogans, and pictures. Moreover, participants discussed different ways to frame the survey. For example, emphasizing that the participant was important and valuable and that their opinions would affect the outcome of the study would increase survey participation.
Main theme 3: Individual-Level Factors
Finally, participants elaborated on individual-level factors they thought might influence the likelihood of participating in surveys across two subthemes.
3.1. Survey Self-Efficacy, Interest, and Engagement. Several participants believed that their ability to formulate their thoughts into opinions was a hurdle for participation (which we in the suggested hypotheses below define as low survey self-efficacy). They expressed that they did not want to cause problems for the interviewer by not knowing how to appropriately fill out questionnaires or develop their thoughts into opinions. Furthermore, interest and engagement in the topics being asked about were also mentioned as factors for participation.
Subtheme 3.2. Language Skills. Participants also expressed that Swedish language skills were important to get them to participate in surveys and that translating questionnaires would have increased their response propensity.
Hypotheses Generated
To guide future research, the mechanisms identified in the exploratory phase were translated into suggested hypotheses presented in Table 2 and discussed below.
Table 2
Hypotheses Generated through the Focus Group Analysis
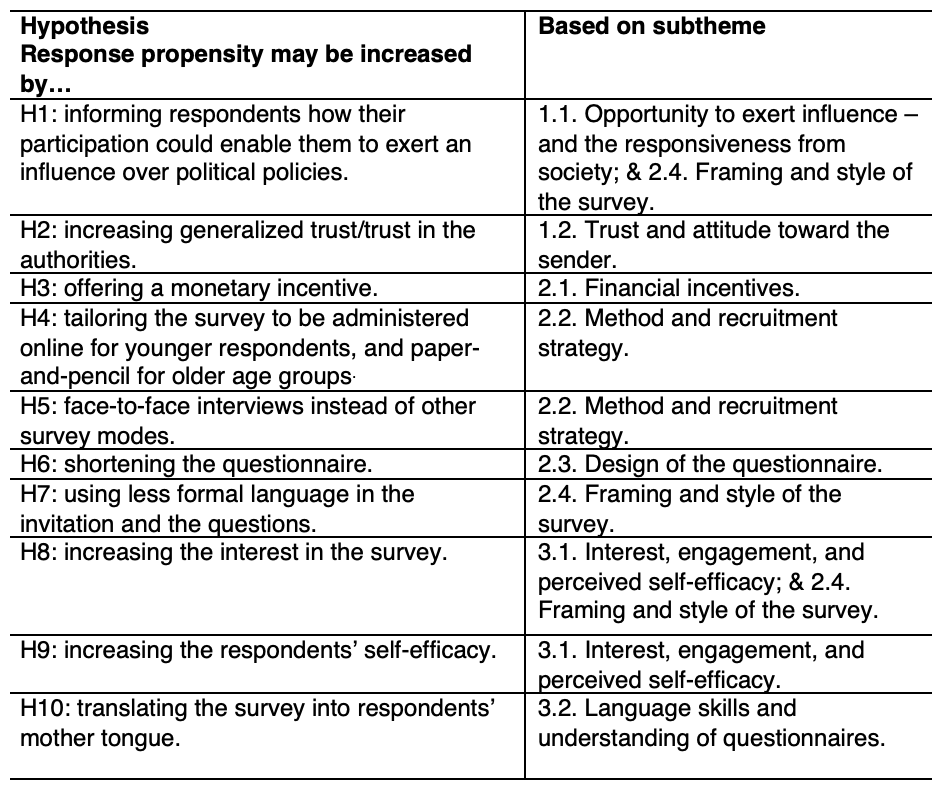
Note. The hypotheses were generated through focus group interviews with immigrants and young adults living in socially disadvantaged areas.
H1 suggests that perceiving oneself as not able to influence and understand policy may decrease response propensities. Such internalized perception of the ability to influence is called internal political efficacy (Balch, 1974). The participants expressed desires to influence issues but expressed limits to their potential of doing so. They argued this limit was a reason for their non-participation in surveys. Research has identified that a decreasing willingness to bear social responsibility (e.g., voter turnout) was related to declining response rates (Brick & Tourangeau, 2017), and internal political efficacy has, in turn, been found to be related to voting behavior (see Balch, 1974). However, to the authors’ knowledge, the hypothesis that leveraging internal political efficacy may increase response propensities among hard-to-reach groups has not been proposed previously.
H2 posits that increasing generalized trust and trust in the authorities may increase response propensities. Several focus groups suggested that distrust toward other people and the authorities was a reason for their non-participation. The decline in societal trust has been identified as a likely cause for the declining response rates in the U.S. and Europe (Couper & de Leeuw, 2015; Shaghaghi et al., 2011). Finding ways to increase generalized and institutional trust, at least temporarily, may persuade low-trusting respondents to participate in surveys.
H3 suggests that incentives may increase response propensities, especially among young adults, immigrants, and people living in socially disadvantaged areas. Several studies have found that incentives increase response propensities (Singer & Ye 2013). H3 suggests that incentives may be of increased importance for raising response propensities among these hard-to-reach subgroups and survey requests may be fruitfully tailored to offer incentives identified as relevant for the subgroups with low response propensities.
H4 posits that response propensity may be increased by administering surveys online among younger respondents while administering mail surveys to older respondents. This hypothesis fits the theory of a tailored survey design (Dillman et al., 2014) suggesting that the survey mode be tailored to the mode the respondent prefers (see also Sakshaug et al., 2019) or offer multiple modes concurrently (Olson et al., 2012; for an overview, see de Leeuw, 2018).
H5 suggests that response propensities may be increased by offering face-to-face interviews over other modes, especially among immigrants. Previous research has found that allowing reluctant respondents to be interviewed face-to-face interview can increase a respondent sample’s resemblance to the population (Klausch et al., 2015) and that immigrants seem especially helped by in-person interviews (Kappelhof, 2015). Face-to-face interviews may allow immigrants the chance to ask clarifying questions, which was mentioned as important by several of the immigrant focus group participants, and surveys may be optimized by tailoring the mode to be face-to-face for this group.
H6 suggests that shorter surveys may increase response propensities among young adults and immigrants. Short surveys have been found to increase response propensities in general (Japec et al., 1997; Singer, 2011) but may be especially important when interviewing immigrants given that several focus group participants disclosed unfamiliarity with evaluating their attitudes toward their new home country.
H7 suggests that using less formal language in surveys may increase response propensities, especially with the subgroups in the focus groups. Ensuring that survey invitations and questions remain jargon-free and use easy-to-understand language is perhaps the first thing survey methodologists are taught (see Dillman et al., 2014), and appears likely extra important for surveys administered to young adults and immigrants.
H8 suggests that interest in the topic may increase response propensities in general and among low-response propensity groups in particular. This is in line with theories that the topic of the survey can be tailored to increase response propensities (see Singer, 2011) and identifying topics of interest for hard-to-reach groups may allow for optimized tailored designs.
H9 suggests that increased survey self-efficacy may increase response propensities. Survey self-efficacy has, to the authors’ knowledge, not been defined before and we, therefore, define it as an individual’s perceived capacity to successfully fill out a questionnaire or answer questions in a survey interview setting. In general, self-efficacy within a certain domain is inferred through self-esteem, previous performances and anxiety toward the task, support from others and society, and the successful completion of the task by peers (Luzzo et al., 1999). Research has found self-efficacy in specific domains to be highly predictive of whether an individual decides to attempt the completion of a task within that domain (Witte, 1992). Hence, increasing respondents’ survey self-efficacy may increase response propensity, especially among immigrants and those living in socially disadvantaged areas where such efficacy may be lower. To the authors’ knowledge, the role of survey self-efficacy for response propensity has not been suggested before.
H10 suggests that the translation of surveys is likely to generate higher response propensities. This hypothesis has frequently been suggested in the survey methodology literature on surveying immigrants (Bates, 2017; Couper & de Leeuw, 2015) and tailoring the information in survey requests and the interview may be a fruitful way to optimize response propensities for immigrants especially, even among immigrants who are proficient in the main language of the country in which the survey is administered (as the participants in the focus group interviews were).
Confirmation Phase: Survey Experiment
Overview
In the confirmation phase, a survey experiment was administered to assess the first hypothesis generated; That response propensity may be increased when informing respondents that their participation might enable them to exert an influence over policies (i.e., internal political efficacy). This hypothesis was assessed since it captured the subtheme that was prominent across all nine focus group interviews. To assess the hypothesis, a random sample of respondents was randomly assigned to get an invitation to participate in a survey that either included a paragraph on how their participation may influence a policy (treatment group) or not (control group). The procedure, hypotheses, methods, and analytical strategies were preregistered and can be found at osf.io/uxywr.
The survey was administered in September 2020 in collaboration with the Police Department in Trollhättan, Sweden. Given that some participants in the focus groups expressed negative opinions specifically about the police, assessing the hypothesis may seem problematic. However, collaborating with the police offered a unique opportunity to stress the fact that answers may actually influence a real-life policy without the use of deception: Every year, the local police ask the inhabitants what tasks they want the police to prioritize in the upcoming year. This is called a “citizen promise,” and all local police departments in Sweden must generate one such promise each year in collaboration with the municipalities and the inhabitants. The police must base this promise on the results of a survey administered to the public as well as on the input from the local police and municipal civil servants. Hence, explaining to the sampled persons how their participation would inform policy was indeed true in our case.
Sample
The Swedish Tax Authority drew a simple random sample of 400 individuals from seven zip codes selected to cover the socially disadvantaged areas in the city Trollhättan (zip codes 46160–46167), and a simple random sample of 400 individuals from seven not socially disadvantaged areas in Trollhättan (zip codes 46132, 46140–46144, and 46192). Any person aged 16 or older and living in one of the zip codes could be randomly selected. None of the sampled persons were excluded from the study. The Swedish Tax Authority is an inclusive sampling frame where anyone with a Swedish social security number and registered as living in Sweden is included. The register has been shown reliable with only minor estimated under- and overcoverage (Statistics Sweden, 2020). Overcoverage (individuals who have moved from Sweden but have not notified any of the Swedish government agencies) has been identified as the primary source of error (Statistics Sweden, 2020). Statistics Sweden and the Swedish Tax Authority estimated that about 198,000 individuals (1.9% of the total population) were registered at the wrong address in 2018 of which 68,000 were estimated to no longer live in Sweden. Using the registry for sampling should, therefore, be unlikely to skew the results of the study due to undercoverage of immigrants or individuals living in socially impoverished areas.
Procedure
Sampled persons were invited by mail to complete an online questionnaire. The letter of invitation was placed in an envelope (the outside of the envelope had the Swedish Police and the survey organization’s logo). In the invitation, all sampled persons read that they had been invited to complete a survey about their feelings of safety and the upcoming citizen promise. The sampled persons were instructed how to access the online questionnaire (either through a URL or by scanning a unique quick response (QR) code printed at the bottom of the invitation) and that the survey would take about 10 minutes to complete.
In the middle of the frontpage of the invitation, half of the sampled persons were randomly assigned to read a boxed paragraph telling them that, previously, very few people from their area had participated in the citizen promise development and that by completing the questionnaire they would have a better opportunity to influence the policy. The other half of the sampled persons did not see that paragraph. Section S3 in the SOM details the versions of the invitations. Twenty-four days after being invited, a reminder was mailed, and the identical manipulation was administered to the same individuals once more. No other interventions or efforts to raise response rates were administered.
Evaluation Criteria and Measures
The hypothesis was assessed by estimating the intervention’s impact on response rate 1 (RR1) (AAPOR, 2016), nonresponse bias (R-indicators) (Schouten, Cobben, & Bethlehem, 2009), and measurement error (item nonresponse, length of responses to open-ended questions, and non-differentiation) (e.g., Oscarsson & Arkhede, 2019). For the estimations and coding of the measures, see SOM, section S4.
Results
Response Propensity
In contrast to the expected, sampled persons were not more likely to answer the survey when reading that they had the chance to influence a policy (M = 30.77%, SE = 0.02, N = 397) than when not reading this (M = 33.50%, SE = 0.02, N = 403) (b = 0.03, SE = 0.03, p = .41, d = 0.06). Furthermore, the effect that reading about the chance to influence a policy was not moderated by whether the sampled persons lived in a socially disadvantaged area (b = -0.09, SE = 0.07, p = .15, d = 0.10) (see Figure 1). The effect was also not moderated by whether the sampled person was an immigrant or not (b = -0.05, SE = 0.07, p = .46, d = 0.05) (see SOM, Table S3). Immigrants were here defined as individuals not born in Sweden who had a Swedish social security number and were currently registered as living in Sweden. A not preregistered alternative logistic regression did not change any of these findings (see Table S4).
Figure 1.
Percentage of Completed Surveys, by Treatment and Type of Area
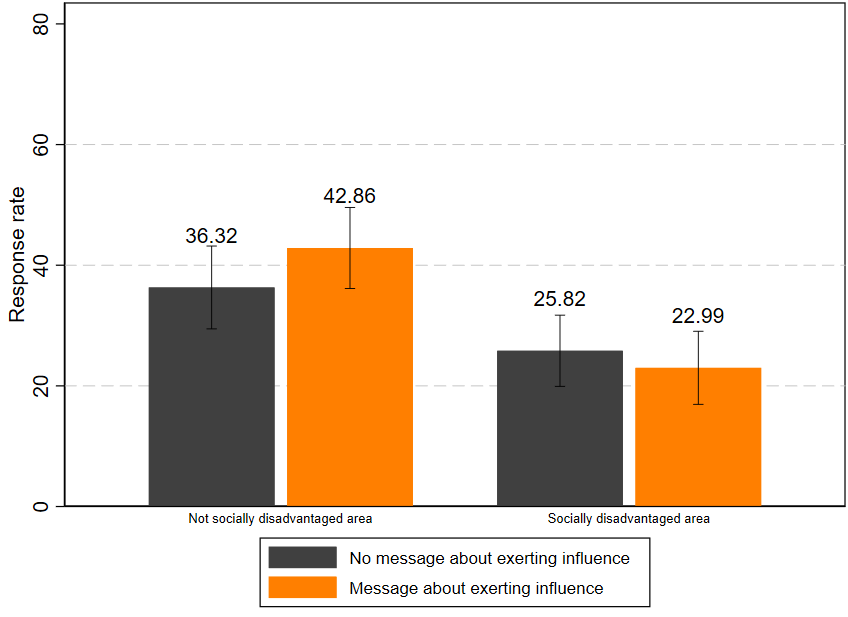
Note. Data from the survey experiment of the confirmation phase.
Nonresponse Bias
In contrast to the expected, the nonresponse bias was greater, with non-overlapping confidence intervals (CIs), when sampled persons read that they had the chance to influence a policy (R-indicator = .72, SE = .05, N = 397, 95% CI[.68, .76]) than when they did not read about that chance (R-indicator = .85, SE = .05, N = 403, 95% CI [.80, .90]). This increase in nonresponse bias was due to immigrants being slightly less likely to complete the survey if they read about the opportunity to exert influence (bnot born in Sweden = ‑0.81, SE = 0.25, p < .01) than when they did not (bnot born in Sweden = ‑0.38, SE = 0.23, p = .10) (see Table S5). In addition, participants aged 40-49 years old were slightly more likely than those 16-24 years old to complete the questionnaire when being told about exerting an influence (b40-49 = 1.69, SE = 0.43, p < .001) than when not (b40-49 = 0.62, SE = 0.41, p = .13).
Measurement Error
Sampled persons reading that they had the chance to influence a policy were not more likely to answer more questions (M = 94.94%, SE = 0.01, N = 144) than when not reading that (M = 94.53%, SE = 0.02, N = 131) (b = 0.00, SE = 0.02, p = .83). This effect was not moderated by living in a socially disadvantaged area (b = 0.02, SE = 0.04, p = .63), nor by immigrant status (b = 0.06, SE = 0.04, p =.11) (see Table S6). However, reading about influencing policy made respondents type statistically significantly fewer characters (M = 281.68, SE = 22.48, N = 138) than not reading about influencing policy (M = 370.33, SE = 40.10, N = 123) (b = -88.65, SE = 44.72, p = 0.05). But an exploratory analysis revealed that this finding was driven entirely by 30 outliers (typing three standard deviations more characters than the sample average) and excluding those revealed that no difference was found between the treatment and control group (b = -15.71, SE = 20.12, p = .436). The effect on the number of characters typed was not moderated by living in a socially disadvantaged area (b = -54.85, SE = 41.43, p = 0.19), nor by immigrant status (b = -46.90, SE = 43.30, p = .28) (see Table S7).
Conclusion
In this manuscript, an exploratory and a confirmatory phase were used to generate and assess hypotheses for nonresponse and response propensities to surveys in general and among immigrants and socially disadvantaged areas in particular. The exploratory phase produced several different hypotheses for mechanisms driving non-response among immigrants, young adults, and people living in socially disadvantaged areas. Many of the generated hypotheses have already been proposed in survey research, but our findings allude to their added importance when studying hard-to-reach groups like immigrants and people living in socially disadvantaged areas. However, two of the hypotheses generated appear completely novel to survey methodology: internal political efficacy (the perceived ability to influence policy) and survey self-efficacy (the perceived ability to answer surveys) may play a particularly important role for these groups. Perhaps hard-to-reach groups are opting not to participate because they believe they will do poorly in describing their attitudes and behaviors. If so, such respondents may inaccurately believe that non-participation is the most altruistic act and poses the best way to help the researcher or survey sender. Furthermore, even if they believe in their ability to answer the survey, a lack of internal political efficacy may persuade them to participate since their attitudes and beliefs will not be listened to anyway.
In the confirmation phase, we did not find support for that attempting to increase internal political efficacy increased response propensities. We posit four explanations for this lack of support: (1) The sample was not large enough to detect small response propensity changes and a posthoc power analysis indicated that 2,175 individuals would have been needed for our observed effect size to be statistically significant with 80% power. (2) The manipulation confounded information about exerting influence over policy and informing that few in the neighborhood had previously participated in citizen promises. Informing about both simultaneously was done to increase the strength of the manipulation by explicating that the individual’s participation would be especially likely to affect policy. Future research could investigate the impact of deconfounding the manipulation and whether the manipulations canceled each other out. (3) Distrust in the police may have influenced the believability of our manipulation. Although the collaboration with the police allowed testing the impact of telling respondents about their real chances to influence policy, distrust in the policy may have influenced the believability of our manipulation. Future research should test whether trust in the institutions or organizations influences respondents’ trust that participation will influence real-life policy. Or (4) the hypothesis generated in the focus group simply did not generalize to a population outside the interviews.
Lastly, we want to encourage other social scientists to assess the hypotheses generated here. Evaluating the proposed mechanisms behind response propensities will be crucial for developing the tools needed to stem the rising tide of nonresponse bias in surveys and among hard-to-reach populations.
Supplementary Online Materials (SOM)
References
- AAPOR. (2016). Standard definitions: Final dispositions of case codes and outcome rates for surveys. 9th edition. The American Association for Public Opinion Research.
- Abraham, K. G., Maitland, A. & Bianchi, S. M. (2006). Nonresponse in the American time use survey: Who is missing from the data and how much does it matter? The Public Opinion Quarterly, 70, 676–703.
- Balch, G. I. (1974). Multiple indicators in survey research: The concept sense of political efficacy. Political Methodology, 1–43.
- Barron, D. S., Holterman, C., Shipster, P., Batson, S., & Alam, M. (2010). Seen but not heard – Ethnic minorities’ views of primary health care interpreting provision: a focus group study. Primary Health Care Research & Development, 11, 132–141.
- Bates, N. (2017). The Morris Hansen lecture. Hard-to-survey populations and the U.S. census: Making use of social marketing campaigns. Journal of Official Statistics, 33, 873–885.
- Bates, N., & Mulry, M. H. (2011). Using a geographic segmentation to understand, predict, and plan for census and survey mail nonresponse. Journal of Official Statistics, 27, 601–618.
- Braun, V., & Clarke, V. (2006). Using thematic analysis in psychology. Qualitative Research in Psychology, 3, 77–101.
- Breen, R. L. (2006). A practical guide to focus-group research. Journal of Geography and Higher Education, 30, 463–475. doi:10.1080/03098260600927575
- Brick, J. M., & Tourangeau, R. (2017). Responsive survey designs for reducing nonresponse bias. Journal of Official Statistics, 33, 735-752.
- Brick, J. M., & Williams, D. (2013). Explaining rising nonresponse rates in cross-sectional surveys. The ANNALS of the American Academy of Political and Social Science, 645, 36–59.
- Christensen, A. I., Lynn, P., & Tolstrup, J. S. (2019). Can targeted cover letters improve participation in health surveys? Results from a randomized controlled trial. BMC Medical Research Methodology, 19(1), 1–8. https://doi.org/10.1186/s12874-019-0799-4
- Couper, M. P., & D. de Leeuw, E. (2015). Nonresponse in cross-cultural and cross-national surveys. In J. Harkness, F. van de Vijver, & P. P. Mohler (Eds.), Cross-cultural Survey Methods. Wiley.
- Crabtree, B., Yanoshik, M., Miller, W., & O’Connor, P. (1993). Selecting individual or group interviews. In D.L. Morgan (Ed.), Successful Focus Groups: Advancing the State of the Art (pp. 137-150). SAGE Publications, Inc., https://doi.org/10.4135/9781483349008
- Dillman, D. A. (2020). Towards Survey Response Rate Theories That No Longer Pass Each Other Like Strangers in the Night. In P. S. Brenner (Ed.), Understanding Survey Methodology: Sociological Theory and Applications (1st ed., pp. 15–44). https://doi.org/10.1007/978-3-030-47256-6_2
- Dillman, D. A., Smyth, J. D., & Cristian, L. M. (2014). Internet, phone, mail, and mixed-mode surveys: the tailored design method. John Wiley & Sons.
- Ekström, M. (2010). Gruppintervjuer (Fokusgrupper), In Ekström, M., & Larsson, L. (Eds,), Metoder i kommunikationsvetenskap. Lund: Studentlitteratur.
- Groves, R. M. (2006). Nonresponse rates and nonresponse bias in household surveys. Public Opinion Quarterly, 70, 646–675.
- Groves, R.M., & Couper, M.P. (1998). Nonresponse in household interview surveys. Wiley.
- Groves, R. M., Singer, E., & Corning, A. (2000). Leverage-Saliency theory of survey participation – Description and an illustration. Public Opinion Quarterly, 64, 299–308.
- Groves, R. M., & Heeringa, S. G. (2006). Responsive design for household surveys: Tools for actively controlling survey errors and costs. Journal of the Royal Statistical Society Series A (Statistics in Society), 169, 439–457.
- Grønkjær, M., Curtis, T., Crespigny, C., & Delmar, C. (2011). Analysing group interaction in focus group research: Impact on content and the role of the moderator. Qualitative Studies, 2, 16–30.
- Göteborgs Stad. (2022). Antal personer födda i Sverige eller utlandet i Norra och Södra Biskopsgården 2022. Statistikdatabas Göteborgs Stad. Accessed on April 27, 2022, at http://statistikdatabas.goteborg.se/pxweb/sv/1.%20G%c3%b6teborg%20och%20dess%20delomr%c3%a5den/1.%20G%c3%b6teborg%20och%20dess%20delomr%c3%a5den__Prim%c3%a4romr%c3%a5den__Befolkning__Utrikes%20f%c3%b6dda/10_FoddSvUtl_PRI.px/table/tableViewLayout1/
- Japec, L., Ahtiainen, A., Hörngren, J., Lindén, H., Lyberg, L., & Nilsson, P. (1997). Minska bortfallet. Statistiska centralbyrån. Accessed on June 7, 2022, at https://www.scb.se/contentassets/d62df838f1ac40648b3c29f79fa88c7c/minska-bortfallet.pdf
- Kappelhof, J. (2015). The impact of face-to-face vs sequential mixed-mode designs on the possibility of nonresponse bias in surveys among non-western minorities in the Netherlands. Journal of Official Statistics, 31(1), 1–31.
- Keeter, S., Kennedy, C., Dimock, M., Best, J., & Craighill, P. (2006). Gauging the impact of growing nonresponse on estimates from a national RDD telephone survey. Public Opinion Quarterly, 70(5), 759–779.
- Klausch, T., Hox, J., & Schouten, B. (2015). Selection error in single and mixed mode surveys of the Dutch general population. Journal of the Royal Statistical Society: Series A, 178(4), 945–961.
- de Leeuw, E. D. (2018, August). Mixed-mode: Past, present, and future. Survey Research Methods, 12(2), pp. 75-89.
- Lundmark, S., & Backström, K. (2023, June 15). Predicting survey nonresponse with registry data in Sweden between 1992 to 2022: Cohort replacement or a deteriorating survey climate? https://doi.org/10.31234/osf.io/8xsyb
- Luzzo, D., Anthony, P., Katrice H. A., Maureen, A. Bibby, A., & Martinelli Jr., E. A. (1999). Effects of self-efficacy-enhancing interventions on the math/science self-efficacy and career interests, goals, and actions of career undecided college students. Journal of Counseling Psychology, 46, 233.
- Lynn, P. (2014). Targeted response inducement strategies on longitudinal surveys. In improving survey methods: Lessons from recent research. In P. Lynn (Ed.), Improving Survey Methods (pp. 322–338). Routledge.
- Nápoles-Springer, A. M., Fongwa, M. N., Stewart, A. L., Gildengorin, G., & Pérez-Stable, E. J. (2004). The effectiveness of an advance notice letter on the recruitment of African Americans and whites for a mailed patient satisfaction survey. Journal of Aging and Health, 16, 124S–136S.
- Morgan, D., & Krueger, R. (1993). When to use focus groups and why. In D. Morgan (Ed.), Successful Focus Groups: Advancing the State of the Art (pp. 3-19). SAGE Publications, Inc.
- Olson, K., Smyth, J. D., & Wood, H. M. (2012). Does giving people their preferred survey mode actually increase survey participation rates? An experimental examination. Public Opinion Quarterly, 76(4), 611-635.
- Oscarsson, H., & Arkhede, S. (2019). Effects of conditional incentives on response rate, nonresponse bias and measurement error in a high response-rate context. International Journal of Public Opinion Research, 32, 354–368. doi:10.1093/ijpor/edz015
- Polisen (2021). Utsatta områden – polisens arbete. Accessed on September 5, 2023 at https://polisen.se/om-polisen/polisens-arbete/utsatta-omraden/
- Sakshaug, J. W., Vicari, B., & Couper, M. P. (2019). Paper, E-mail, or Both? Effects of Contact Mode on Participation in a Web Survey of Establishments. Social Science Computer Review, 37(6), 750–765.
- Schouten, B., Cobben, F., & Bethlehem, J. (2009). Indicators for the representativeness of survey response. Survey Methodology, 35, 101–113.
- Shaghaghi, A., Bhopal, R. S., & Sheikk, A. (2011). Approaches to recruiting “hard-to-reach” populations into research: A review of the literature. Health Promotion Perspectives, 1, 86–94.
- Singer, E. (2011). Toward a benefit-cost theory of survey participation: Evidence, further tests, and implications. Journal of Official Statistics, 27, 379–392.
- Singer, E., & Ye, C. (2013). The use and effects of incentives in surveys. The ANNALS of the American Academy of Political and Social Science, 645, 112–141.
- Statistics Sweden (2018). Tydlig skillnad bland unga i särskilt utsatta områden. Accessed on June 7, 2022 at https://www.scb.se/hitta-statistik/artiklar/2018/tydliga-skillnader-bland-unga-i-sarskilt-utsatta-omraden/#:~:text=S%C3%A4rskilt%20stor%20var%20skillnaden%20i,procent%20j%C3%A4mf%C3%B6rt%20med%2034%20procent
- Statistics Sweden (2022). Utrikes födda i Sverige. Accessed on May 18, 2022 at https://www.statistikdatabasen.scb.se/pxweb/sv/ssd/START__BE__BE0101__BE0101E/InrUtrFoddaRegAlKon/table/tableViewLayout1/
- Stoop, I. A. (2004). Surveying nonrespondents. Field Methods, 16(1), 23-54.
- Stoop, I. A., Billiet, J., Koch, A., & Fitzgerald, R. (2010). Improving survey response: Lessons learned from the European Social Survey. John Wiley & Sons.
- Tourangeau, R., Michael Brick, J., Lohr, S., & Li, J. (2017). Adaptive and responsive survey designs: a review and assessment. Journal of the Royal Statistical Society. Series A: Statistics in Society, 180(1), 203–223.
- Vahabi, M., Isaacs, S., Koc, M., & Damba, C. (2015). Challenges in recruiting hard-to-reach populations focusing on Latin American recent immigrants. International Journal of Human Rights in Healthcare, 8.
- van Wees, D. A., Daas, C. , Kretzchmar, M. E., & Heijne, J. C. M. 2019. Who drops out and when? Predictors of nonresponse and loss to follow-up in a longitudinal cohort study among STI clinic visitors. PLOS ONE 14: 1–15.
- Williams, D., & J. Brick, M. (2018). Trends in US face-to-face household survey nonresponse and level of effort. Journal of Survey Statistics and Methodology, 6, 186–211.
- Witte, K. (1992). Putting the fear Back into fear appeals: The extended parallel process model. Communications Monographs, 59, 329–349.
- Yancey, A., Ortega, A. N, & Kumanyika, S. K. (2006). Effective recruitment and retention of minority research respondents. Annual Review of Public Health, 27, 1–28.
-
Keywords
calibration CATI coverage coverage bias cross-national surveys data linkage data quality European Social Survey experiment face-to-face face-to-face survey Facebook hard to reach populations incentives item nonresponse measurement measurement error mixed-mode surveys multitasking non-probability samples Nonresponse nonresponse bias nonresponse rates paradata PIAAC Probability sample probability samples QR codes rare populations response rate Satisficing social desirability Social media survey survey-taking climate survey data survey management survey methods Telephone survey telephone surveys total survey error unit nonresponse validity web survey Web surveys weighting
