

Time and sample quality in a Facebook ad-generated survey with Polish migrants in the UK

Piekut, A. (2024). Time and sample quality in a Facebook ad-generated survey with Polish migrants in the UK. Survey Methods: Insights from the Field. Retrieved from https://surveyinsights.org/?p=19354. The replication package available for reuse is available here: https://osf.io/wbzun/
© the authors 2024. This work is licensed under a Creative Commons Attribution 4.0 International License (CC BY 4.0) 
Abstract
Migrants are considered a hard-to-reach population – it is hard to recruit them due to lack of accessible sampling frames or recruit in a timely manner if frames are available or self-constructed. Recently, social media advertisement campaigns (ads) have become an increasingly popular method of recruiting hard-to-reach populations, including migrants, due to lower costs and time efficiency. In this paper we concentrate on the time element of some online survey fieldwork where recruitment was facilitated with targeted Facebook ads. The paper uses data from a survey conducted for a project on the impacts of Covid-19 on Polish migrant essential workers in the UK. Over a period of four weeks in 2021, we collected 1,105 valid responses and 66% of them (735) came from a dedicated Facebook ad campaign. We review the campaign performance over time and explore different time indicators – fieldwork day, sampling stage and sampling stage day – and whether they are associated with survey response quality, satisficing and estimations. The results indicate that less-cooperative respondents are recruited later in the fieldwork, but also that the sampling stage day correlates with respondents’ engagement.
Keywords
Facebook, fieldwork length, non-probability samples, sample quality, Satisficing, Social media survey, time
Acknowledgement
I wish to thank Dr Anna Gawlewicz, Dr Mark Taylor and anonymous reviewers for their helpful comments on the previous version of the article. This work was supported by the Economic and Social Research Council (ESRC) as part of UK Research and Innovation's rapid response to COVID-19 under Grant ES/V015877/1.
Copyright
© the authors 2024. This work is licensed under a Creative Commons Attribution 4.0 International License (CC BY 4.0)
Introduction
Time is an important aspect of survey research – longer fieldwork might be more effective in increasing survey participation, but often increases fieldwork costs (Struminskaya & Gummer 2022). While the discussion about the optimal length of survey fieldwork is well established in the case of probability surveys (e.g., Sigman et al. 2014; Sturgis et al. 2017), it is less so in the still-novel approach of recruiting via social media advertisements (ads), where debates on conducting quality studies have emerged recently (Iannelli et al. 2020; Kühne & Zindel 2020; Neundorf & Öztűrk 2023). The financial costs of online surveys might be lower, but the sample quality is another, if not the most important, cost (Olamijuwon 2021).
Instead of dismissing such sampling approaches due to their non-probability character, scholarship based on ‘traditional’ probability approaches can be used to evaluate them and think about ways forward (Pötzschke 2022). In this paper we consider the question of survey length for a Facebook ad-generated sampling for an online survey. We explore this using an survey of Polish migrant essential workers (PMEW) in the United Kingdom conducted via a Facebook ad campaign during the Covid-19 pandemic, from 27 February until 26 March 2021. We investigate whether our survey recruited respondents who perform ‘better’ or ‘poorer’ across different stages of sampling. As such, the paper has two original contributions to survey research relying on participant recruitment from social media sites. First, the survey length in Facebook-ad generated samples with hard-to-reach populations has not been studied in academic research before. Second, we combine using several classic sample quality indicators (e.g., response behaviours and propensity to satisfice), and systematically apply measures unique for Facebook-ad generated samples for campaign performance, sampling effectiveness and survey outcomes, contributing to the discussion about how to evaluate the quality of such samples (Stern et al. 2017).
The paper is organised as follows. First, we discuss the Facebook ad campaign as a tool for recruitment of survey respondents. Then we consider how the duration of a fieldwork is related to the quality of a survey sample and how it is relevant for Facebook-ad generated samples. We follow by overviewing our project of PMEW and the design of the ad campaign. After all datasets and methods are introduced, we present the results focusing on the Facebook ad campaign performance over time and the indicators of response quality. We conclude with a discussion of study limitations and ways forward for survey recruitment of hard-to-reach populations via Facebook ads.
Facebook advertisements as a sampling tool
Social media ads allow fast data collection across space (e.g., globally) and time (e.g., within a few days), are more affordable than traditional sampling methods (Pötzschke 2022), and can be used when they cannot, for instance, during the Covid-19 lockdown. Social media can provide researchers better access to hard-to-reach groups than standard non-probability sampling does (Kühne & Zindel 2020). As such, Facebook ads have attracted attention in studies of migrants and refugees (Elçi et al. 2021; Pötzschke & Braun 2017; Pötzschke & Weiß 2020), LGBTQ populations (Kühne & Zindel 2020), conspiracy theories believers (Iannelli et al. 2020), cannabis users (Borodovsky et al. 2018), and health emergencies (Farr et al. 2022; Grow et al. 2020; Whitaker et al. 2017).
Ads on Facebook were introduced three years after it launched in 2007 and the contemporary format of a three-layer ad campaign in 2014, that is, the campaign, ad set and ad (Fuchs 2020; Pötzschke & Braun 2017). Campaigns, the highest level, are defined by a specific objective, such as generating traffic to an external website, which can be a survey website with a questionnaire. Ad sets, the middle-level units, are used to specify the target population, timeframe and are assigned budget (Kühne & Zindel 2020). This is useful as a population defined by each ad set can be of different size or response propensity, so budget can be placed flexibly across them. Finally, many ads of different designs can be included within one ad set.
Facebook Ads Manager was not designed as a sampling tool, so achieving representative samples is not straightforward (Choi et al. 2017; Stern et al. 2017). The specifics of an algorithmic optimisation deciding which ad is displayed to whom are not well known outside Meta (Kühne & Zindel 2020). If the most common optimisation via ads clicks is chosen, the performance of the ad campaign changes over time, as the algorithm learns which users are more likely to click the ad and it is more often displayed to users of some shared similarity with that initial ‘clickers’. This selection bias changes its dynamic over time, as the pool of more-cooperative potential respondents is used up, so ‘over time the processes by which users selected themselves into the survey may have changed’ (Grow et al. 2020). This raises the question of time, and whether the duration of the ad campaign matters for the quality of a survey generated ads.
Survey quality and fieldwork length
The length of the survey fieldwork is related with the concept of a reluctant respondent – a respondent whose recruitment takes longer (Fitzgerald & Fuller 1982). They are less interested in the topic of the survey and might have different profiles and survey behaviour, which translates into gathered data quality (Green 1991). Their behaviours often fall into survey satisficing, that is, making minimal cognitive effort to fill in a survey (Krosnick 1991).
Evidence is mixed regarding the impact of reluctant respondents on survey quality (Yan et al. 2004). Some evidence indicates more measurement error coming from reluctant respondents, as later participation with recall items might increase cognitive burden (Kreuter et al. 2014) and that late respondents differ across many socio-demographic characteristics from the ones coming earlier (Irani et al. 2004; Sigman et al. 2014). Early respondents have a lower item nonresponse rate, while late respondents drop out of the survey at a higher rate (Rao and Pennington 2013). The relationship between reluctance and survey satisficing might be spurious, largely explained by cognitive abilities (measured with education and age) of respondents (Kaminska et al. 2010). Other studies found that differences in mean responses between cooperative and reluctant respondents and participant characteristics were insignificant (Billiet et al. 2007), or that longer fieldwork and more subsequent calls/reminders do not change the survey estimates substantially (Sturgis et al. 2017), especially if they know survey end-date, so can postpone replying (Borg & Tuten 2016).
For a name- or address-based sampling frame it is easy to calculate person-specific time from sending an invitation to participate to the time of survey completion. For social media sampling, we have information about the start date of the campaign, but this does not mean potential respondents will see our ad immediately or at all (e.g., it might not land in the feed or they might miss it). Additionally, because the algorithm learns throughout the campaign who is the campaign target population, especially in the first 48–72 hours (Borodowsky et al. 2018), not all respondents are invited from day one. In case of sampling via Facebook, the length of the campaign (our survey fieldwork) depends on the population size on Facebook and available budget. Larger budgets will provide access to a larger pool of Facebook users, and more potential participants, so our sampling will be more effective and the fieldwork can be shorter. For example, Neundorf & Öztűrk (2023) targeted the general population in the UK and closed the campaign just after seven days (9–15 Feb 2021) after collecting 1,800 responses. For studies with harder-to-reach groups, such as immigrants, the pool of available Facebook users is smaller. Hence, the campaign length is a matter of managing the study context (i.e., avoiding fieldwork that is too long and might be affected by influential geo-political events) and the budget, so spending is not spread too thinly across a long time, because we will lose against other campaigns (if the most popular buying option of ‘auction’ is used). Previous studies using Facebook ads to recruit migrant populations have been consistent in terms of campaign length, and it was about four to five weeks (see Table 1). This might be the linked to following the pioneering study by Pötzschke and Braun (2017).
Table 1. Summary of selected studies with migrants which used Facebook ads
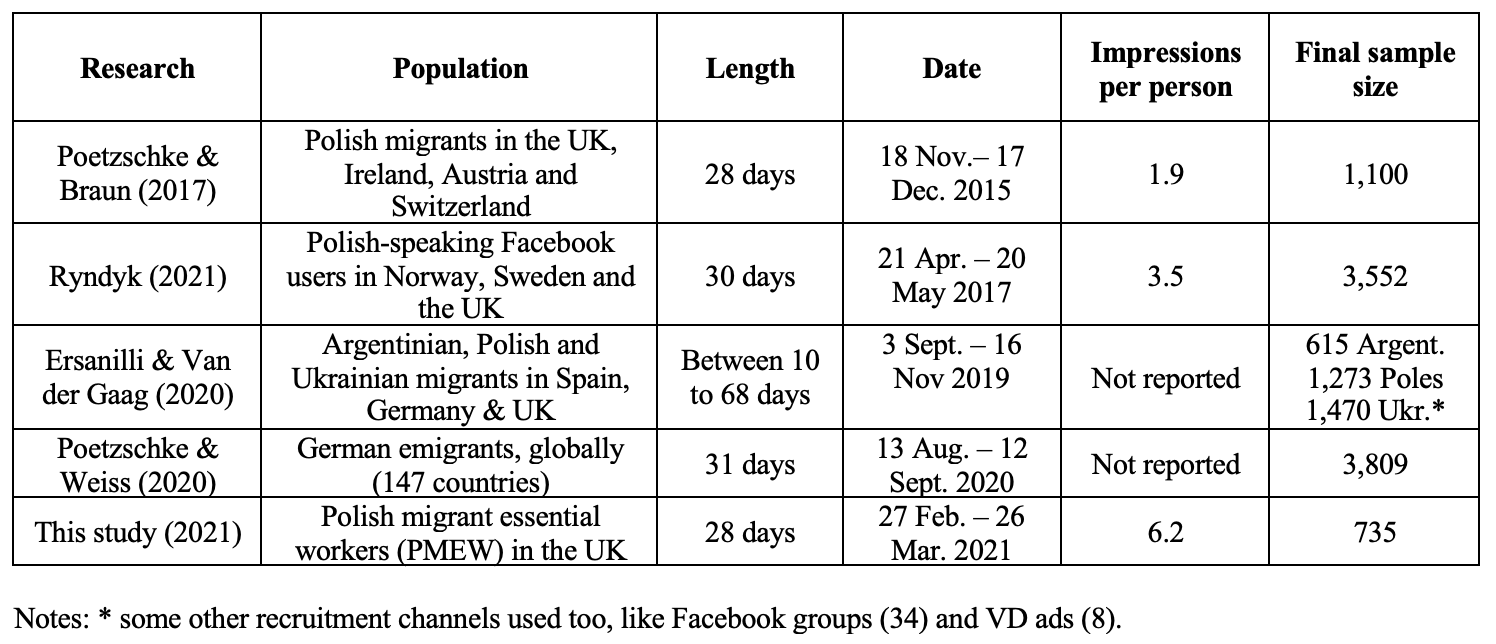
If participants who come to the study at later stages are different, as some studies suggest (Bates & Creighton 2000; Lynn & Clarke 2002), it is worth conducting longer fieldwork and making more recruitment work to diversify the sample and reduce nonresponse bias. In the discussed PMEW study, we consider whether over the course of a few weeks the quality of our Facebook-ad generated survey has changed.
The study
Survey with Polish essential workers in the UK
The survey was a part of a mixed-method sequential research project “Health, social, economic & cultural impacts of Covid-19 on migrant essential workers in the UK” (Gawlewicz et al. 2024; Wright et al. 2023). The study investigated how the Covid-19 pandemic affected lives of Polish migrant essential workers in the UK. Due to a lack of suitable panel data, we employed convenience sampling and recruited 1,105 survey respondents using Qualtrics survey (Piekut et al. 2023). We recruited 66% of them via a dedicated Facebook ad campaign, followed by other Facebook posts (15%), recruitment via partner organisations (9%), the project website (4.3%), respondent sharing a link (3%) and other channels (3%). In sum, we recruited 735 respondents through the Facebook ad campaign. The overall online survey fieldwork spanned seven weeks between 22 February and 12 April 2021, and we ran the Facebook ad campaign for four weeks – from 27 February until 26 March. It is important to note that the fieldwork took part during the third national lockdown in countries in the UK, which started in early January 2021 and restrictions were lifted from April until July 2021. Questionnaire was fielded in English and Polish, and the Polish version was automatically linked to the Facebook ads, which also were in Polish.
Migrants were eligible to take part if they met all three conditions: (1) were of Polish nationality; (2) currently lived in the UK or lived there during the Covid-19 pandemic (from March 2020) for at least three months; and (3) worked in one of the ‘essential work’ sectors during the Covid-19 pandemic (UK Government 2020; Scottish Government 2020; see Figure A1). The survey comprised seven sections: an introduction, consent and eligibility check; current employment situation; work experience during Covid-19; household and caring responsibilities; economic impacts of Covid-19; migration and future plans; and demographics. At the end of the questionnaire, participants had an option to win two £100 and two £50 vouchers, and leave their contact e-mail for a qualitative interview, collected as a separate survey.
Design of the campaign and one ad
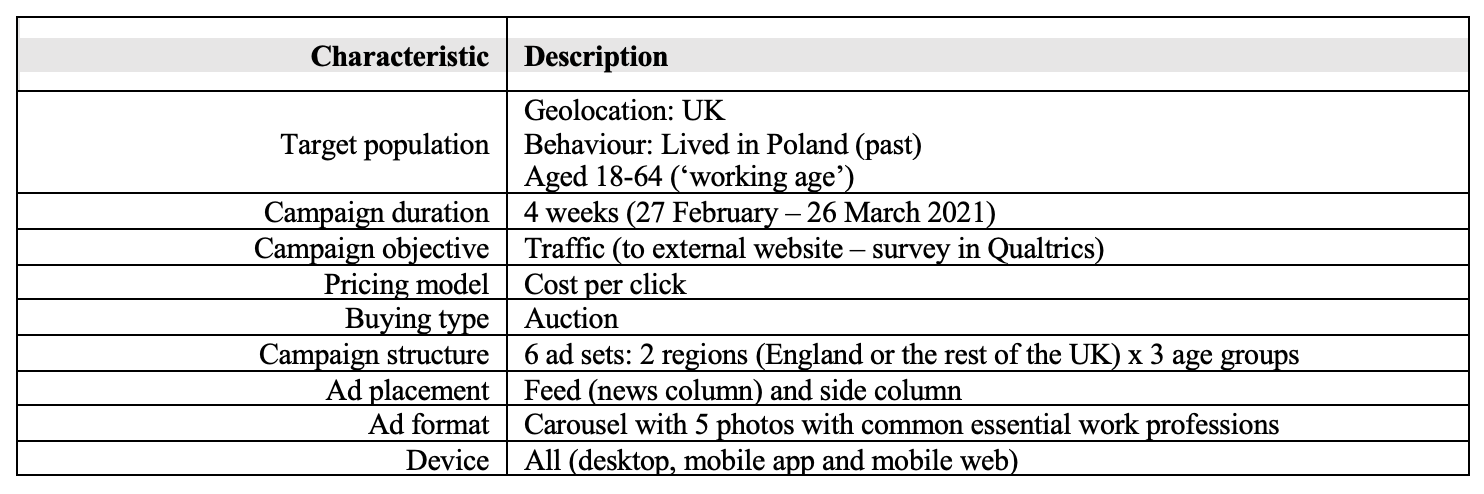
The study population comprised those living in the UK who used to live in Poland and were adults of working age (18–64 years old). Some authors recommend using language-based targeting for migrants (Ryndyk 2021), but in the UK this used to deliver fewer respondents (Ersanilli & Van der Gaag 2020). We use the ‘Lived in Poland (formerly Ex-pats – Poland)’ option as the main targeting option. Facebook estimated the reach of our campaign to be about 411,000 people (as of 26 February 2021, of known age and region, see below). This is less than estimated by the UK Office for National Statistics for Poland-born residents (682,000 +/− 46,000, ONS 2021), and for Polish nationals according to the 2021 Census for England and Wales (743,000, ONS 2022). Not all Poles living in the UK are active online or have a Facebook account, some might have created their accounts after moving there, or moved from another country, so Facebook does not see them as ‘migrants from Poland’. Table 2 summarises our Facebook campaign specifications.
Table 2. Summary of Facebook ad specifications
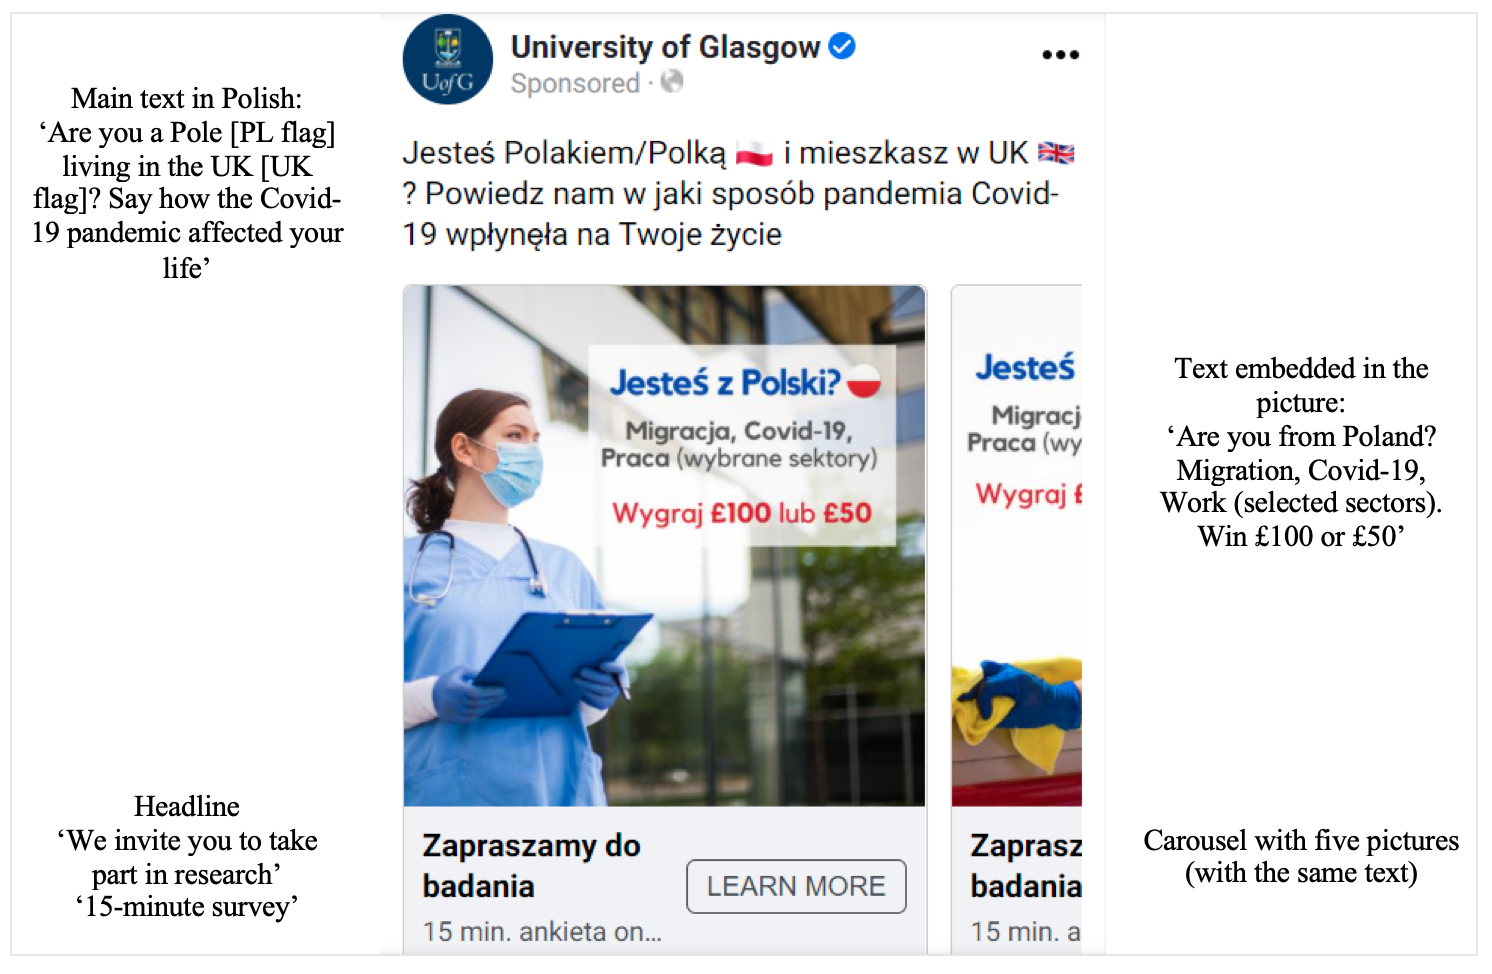
We used the University of Glasgow account to run the campaign, so the university’s logo and name were displayed at the top of the ad. Figure 1 presents the composition of one ad. Since Poles in ‘essential work’ occupations could not be targeted (see below), we used indirect targeting via pictures of the most common essential worker occupations, representing various skills and genders: a female health worker, a female cleaner, a male bus driver, a male delivery person and a female cashier (displayed in a carousel). All the people in the pictures wore facemasks. The primary text in the ad was: ‘Are you a Pole [PL flag] living in the UK [UK flag]? Say how the Covid-19 pandemic affected your life.’ We added text to the photos: ‘Are you from Poland? Migration, Covid-19, Work (selected sectors). Win £100 or £50.’ The headline below the ad stated, ‘We invite you to take part in research’ and the text underneath ‘15-minute survey’. We deliberately decided not to use ‘essential work’ anywhere in the ads, as this may be equated with health and care workers.
Figure 1. Composition of one Facebook ad
Campaign structure (ad sets) and changes in targeting over time
The structure of an ad campaign helps in targeting sub-populations of different characteristics and behaviours online (Zhang et al. 2020). While the initial studies using Facebook ads to recruit migrants did not use many ad sets (for example, Pötzschke and Braun (2017) used the 18–30 and 31+ age groups), recently it has been recommended to define them by more characteristics correlated with the propensity to participate. However, if too many ad sets are created, available budget is spread thinly across many groups, and not all sampling ‘strata’ may be filled (e.g., Rosenzweig et al. 2020). Age and gender (only binary options were available on Facebook at that time) are fairly reliable in terms of targeting users, but Facebook does worse in targeting social characteristics, like occupation or education level (Rosenzweig et al. 2020). We also wanted to have a good sample size for Scotland, so our ad campaign had six ad sets defined by three age groups (18–31, 32–39 and 40+) and two regions (England and the rest of the UK: Scotland, Northern Ireland, Wales and the Crown Dependencies combined). To have similar-sized groups falling into each ad set, we defined them using the latest Annual Population Survey (December 2019; ONS 2020a). As such, our sampling via ads was disproportionate across regions in the UK, since 86% of Poles in the UK lived in England, 9% in Scotland, 6.5% in Northern Ireland and just over 3% in Wales (ONS 2020a).
In February 2021, Facebook assessed that the number of Polish migrant Facebook users per one ad set was 110,000–120,000 in England and 19,000–21,000 in the rest of the country (see Table 3). We started with a three-week-long campaign and allocated £200 per one ad set. Facebook estimated the daily reach to be between 1,500 and 5,000 in England, and 943 and 3,100 outside England, and daily clicks between seven and 30, and five and 23, respectively.
Table 3. Facebook ad campaign population, reach and budget by ad set
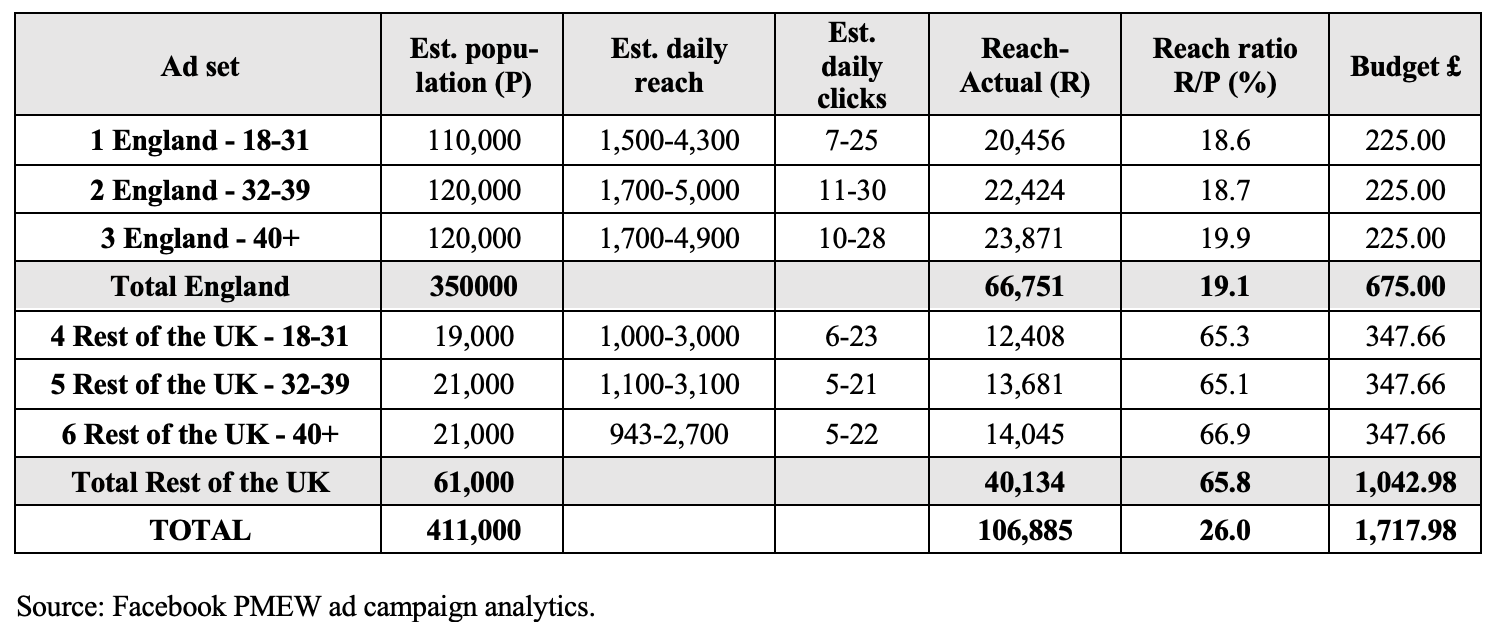
Women are keener to participate in social science research, and after one week 75% of our respondents were female. This selection bias corresponds with previous studies (Ersanilli & Van der Gaag 2020; Pötzschke & Braun 2017). We decided to manage sample ‘representativeness’ and switched off targeting women for 10 days (see Ryndyk (2021) and Zhang et al. (2020) on deactivating/activating ad sets). As our understanding of sampling migrant essential workers via Facebook ads grew, on day 18 we extended the campaign to four weeks and distributed the remaining £300 unevenly, by placing more resources on the ad sets outside England, £75 per ad set, and £25 into each ad set in England. Some additional funds became available in the last days of the campaign, and we hoped to improve sampling in Northern Ireland and Wales, so we placed £72.66 per ad set outside England, but switched off sampling in Scotland. The campaign reach ratio (the proportion of potential (P) to actual reach (R)) was 19% in England and 66% elsewhere.
Table 4. Stages of sampling via Facebook ads
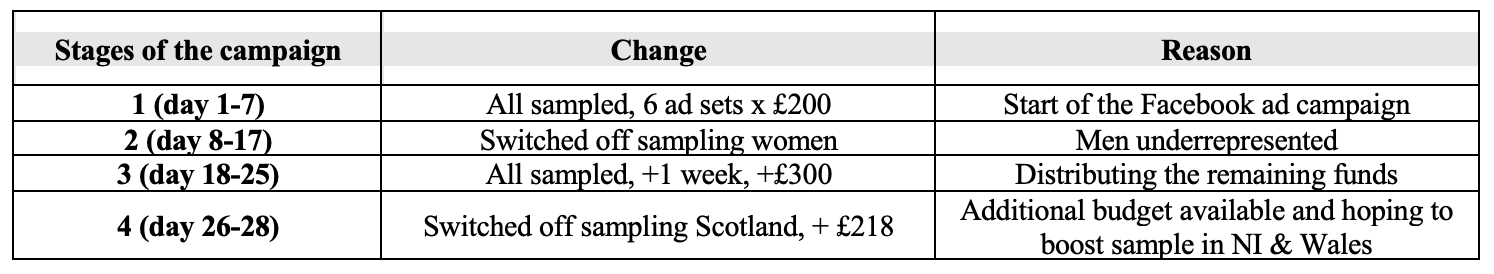
As summarised in Table 4, the changes we made in the campaign design created four distinct stages of sampling. This brings us back to the question of the importance of time and fieldwork duration. In our case, it is important to explore the effect of each sampling stage along the time (survey and stage day) perspective.
Data and methods
Datasets
We use three different datasets to examine the survey performance over time. First, we used PMEW campaign Facebook-side data that was downloadable as spreadsheets for each campaign day with different performance measures: reach, impressions (although users not always see an ad in their feed; Pötzschke & Braun 2017), ad clicks, unique clicks, budget spent and cost per click. While our campaign reach was 106,885 Facebook users, we registered 3,899 clicks on the ads, and 3,382 were unique clicks. After reading the information about the study on the front page of the PMEW survey website, 40% of potential participants moved to the second page of the survey to give consent, and left there a trace of their activity. We will call this dataset Clickers (n=1,356). The final dataset of valid Respondents (who replied to at least 60% of compulsory survey questions) was 735. Figure A3 in the Appendix present the sampling flow chart.
Facebook ad campaign performance indicators
A successful campaign can be determined by how many Facebook users reached by the campaign actually start the survey (the conversion rate), how many people are eligible to take part in the study, and how many provide enough valid answers to be counted as respondents (Iannelli et al. 2020; Neundorf & Öztűrk 2023). In this study the conversions are participants who gave consent to participate and then moved to answering the rest of the survey questions. As described above, eligibility was based on the answers to three screening questions. Among the converted and eligible participants, we distinguished three groups of survey participants: 1) unit nonresponse – 40.1–100% item nonresponse to 26 core questions; 2) reluctant respondents – responded to at least 60% of core questions (1–40% item nonresponse) and 3) engaged respondents – answered all core questions.
Sampling performance and sample quality indicators
We assessed the Respondents data using the following indicators:
- Survey outcome measures: the number of survey participants by type, including respondents per day, and their costs (Neundorf & Öztűrk 2023).
- Response quality is evaluated by looking at response behaviours linked to being a reluctant respondent (Tourangeau et al. 2010; Neundorf and Öztűrk 2023): the proportion of engaged respondents (100% item response), the count of item nonresponse to 26 core items, whether respondents replied to an open question at the end of the survey (‘Tell us more about your experiences’), and the word count of their answer after translation into English and anonymisation.
- Survey satisficing is explored with the following measures: providing contradictory answers to two questions on a reverse scale on workplace discrimination (c5_3 and c5_4, both answered as 1 or 5), straightlining (the same values in answers to a grid of five questions in c5 matrix), survey duration in minutes and survey speeding (the lowest 10% of the sample, 5.9 minutes or less).
Time was operationalised with three variables, introduced in separate models: a sampling stage (one to four), Facebook ad campaign length (day, 1-28) and day of sampling in a sampling stage (stage day, 1-10). We first provide descriptive statistics and then present the regression models results, controlling for variables associated with sampling propensities, including how we managed sampling via the Facebook campaign, and cognitive abilities (Kaminska et al. 2010): gender (men, women, other/missing), age groups used to define ad sets (18–29, 30–39, 40+), UK countries (England, Scotland, other/missing) and education of respondents (with, without higher education, missing). Additionally, eight questions on behaviours, attitudes or the impacts of Covid-19 were regressed against time variables to see if there was a difference in survey estimates across time (Sturgis et al. 2017). Yet, we recognise that the timing of data collection might have encouraged participants who were affected more by the pandemic to self-select into the study. Modelled data is weighted to account for the different sizes of Polish populations across the UK countries (ONS 2020a).
Facebook ad campaign performance
Facebook ad campaign performance over time
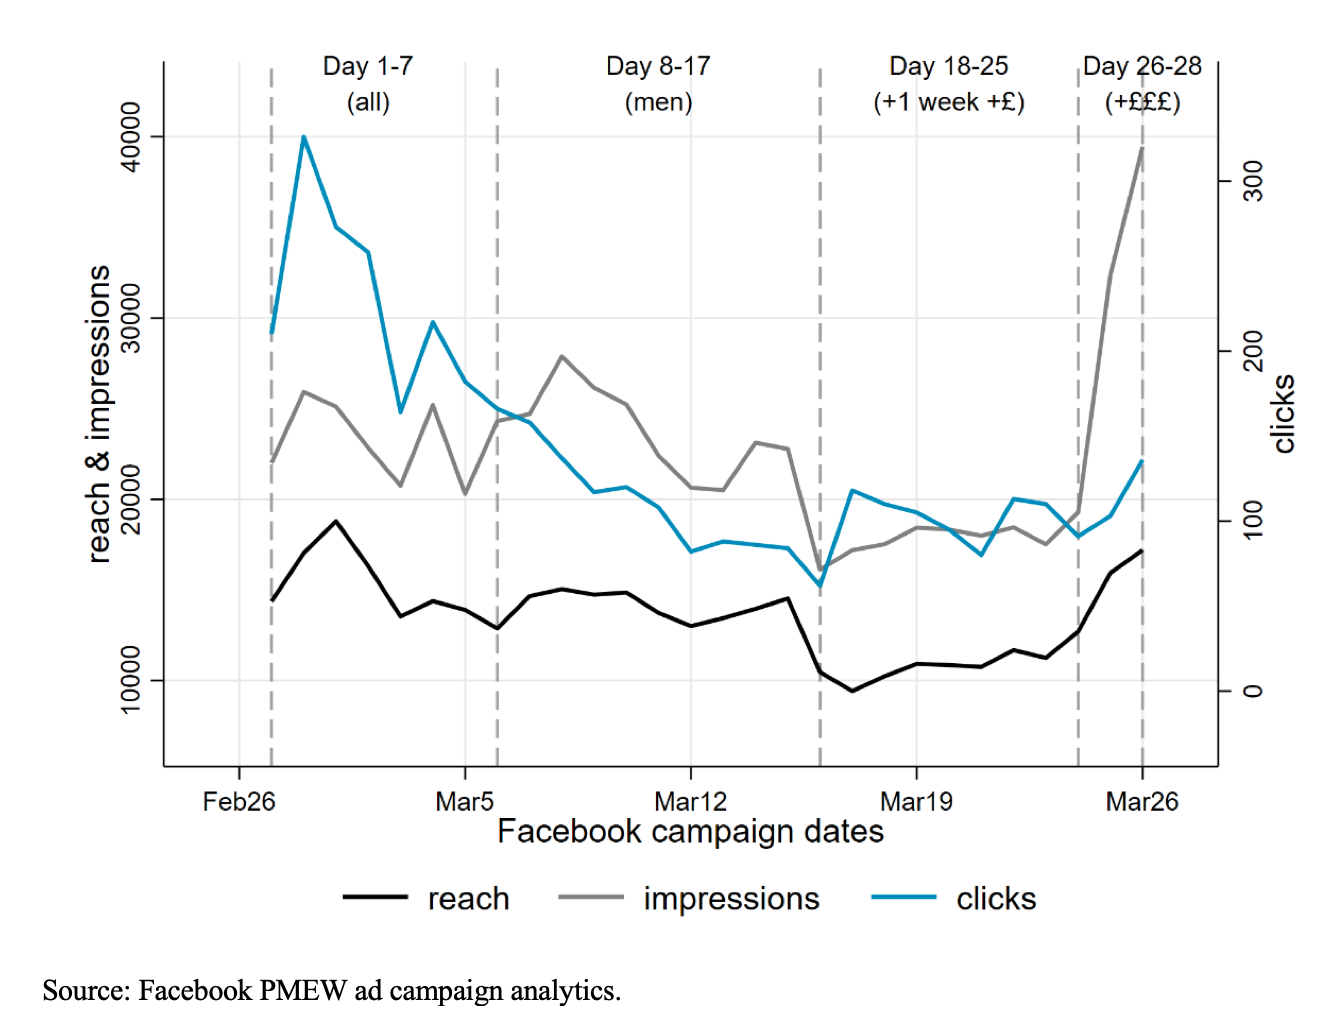
The performance of the ad campaign fluctuated over time. As presented in Figure 2, the campaign reach was at the highest point at the beginning of the campaign, when Facebook’s algorithm was still learning which users were the campaign’s ‘target group’. Each change in the ad settings resulted in an initial drop in the campaign reach, which picked up after a day or two. Stage 3 – when the campaign was stretched to four weeks – performed worse in terms of reach and impressions. Overall, Facebook users engagement with the ads (clicks) was decreasing over time until more funds were added in stages 3 and 4, i.e., in day 18. The costs of the campaign per click dropped in stage 3, but became the most expensive in the shortest stage, stage 4, when extra budget was added for the last three days.
Figure 2. Performance of the ad campaign over time and four sampling stages
Facebook ad campaign sampling performance over time
The question this investigation is driven by is whether the performance of the Facebook ad campaign over time is related to more effective sampling and more engaged respondents. The graphs in Figure 3 illustrate that in the first sampling stage almost 50% of Facebook unique ad clickers moved to the second page of the online questionnaire (Survey clicks), and only about 25% in stages 1 and 3 became respondents.
Figure 3. Sampling performance by participant engagement type
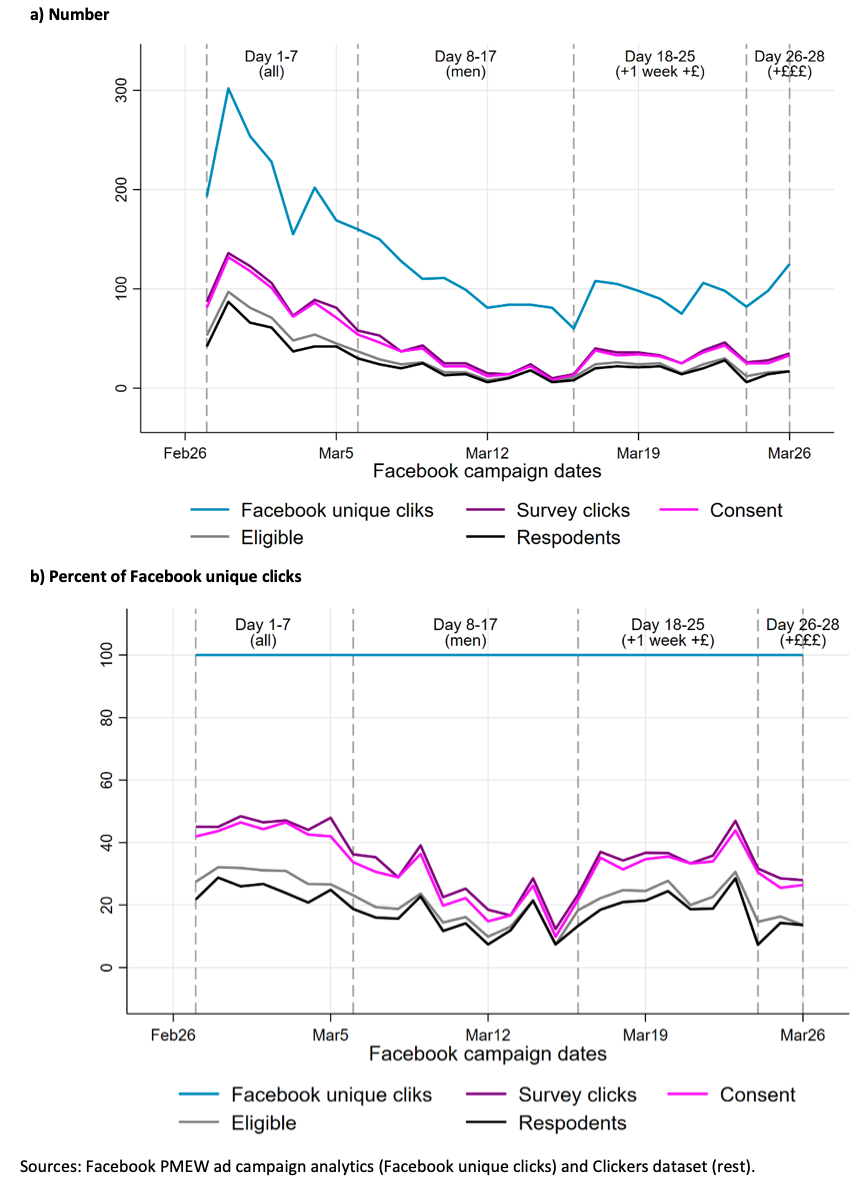
It is interesting that, while in stage 3 (days 18-25) we observed a drop in reach and impressions due to extending the campaign for one more week (see Figure 2), the proportion of conversions and respondents was higher in stage 3 than in the previous stage 2 (days 8-17) when we only sampled men. On the contrary, the additional resources we placed into the final stage of sampling did not translate into more conversions or responses, indicating either that the stage was too short for the algorithm to re-learn or that we had already used the pool of more-cooperative respondents.
Facebook ad campaign sampling performance by stage
Next, we calculated the proportion of participants at different threshold stages of the sampling in relation to the campaign’s actual reach (panel 1, Table 5) and registered survey clicks on our survey website, so considering all survey participants (panel 2, Table 5). Ryndyk (2021) refers to the proportion of survey participants (both complete and incomplete responses) to the Facebook campaign reach as a distinctive measure of response rate, which in our case was just 0.4%. However, not all Polish migrant Facebook users qualified for the study as essential workers, and if one-third of the users were essential workers, as is the case in the UK workforce (ONS 2020b), the response rate would be three times higher, in line with Ryndyk’s (2021) result of 1.3%. The highest rate of survey clicks (the ‘response rate’), conversions to participate and survey eligibility happened in the initial stage of the campaign (days 1-7). The campaign performance deteriorated in stage 2, and improved in stage 3, when we allowed women to be sampled again, but did not go back to the initial level.
Table 5. Sampling outcomes by stage
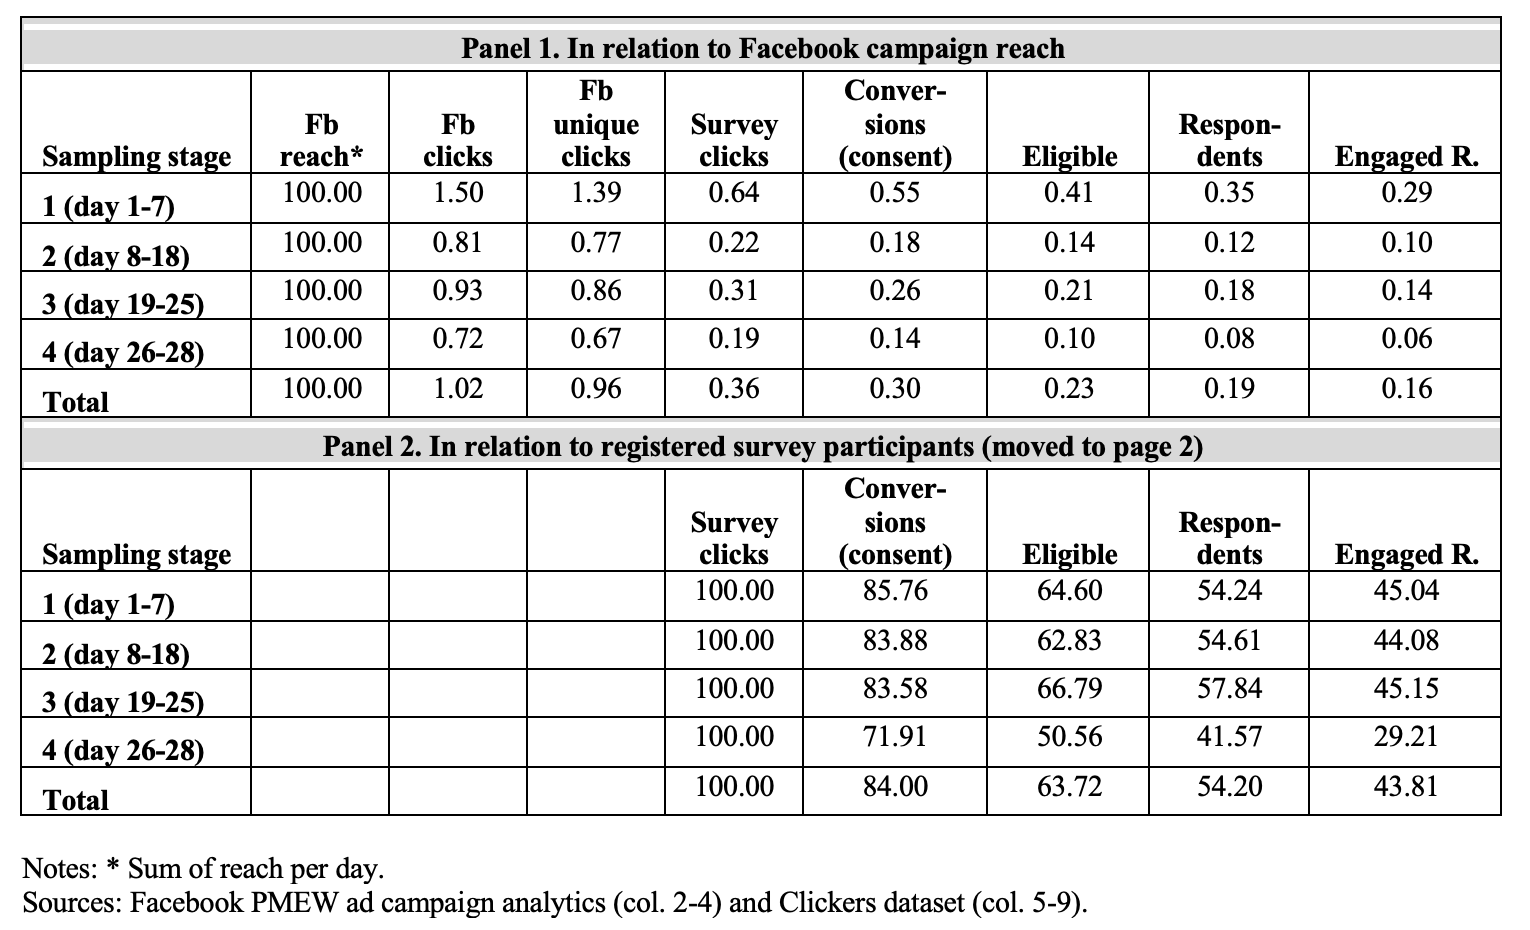
Taking survey participants who left a trace in the online survey as a reference (‘Survey clicks’, lower panel in Table 5), we see that the conversion to start the survey is again highest in stage 1 (86% who moved to the second page of the survey gave consent to take part in the study), at a similar level in stages 2 and 3 (83-84%) and lower in the final stage (72%). However, the proportion of respondents is highest among participants in stage 3 at 57% of survey Clickers, followed by 55% in stages 1 and 2, and just 42% in stage 4. Looking at the proportions of various participants among Clickers (visualised also in Figure 4), stage 2 when only men were sampled, had more people just viewing the consent page (‘No consent’), while stages 3 and 4 had more nonresponse to the eligibility questions, so possibly more Facebook users who were not eligible to participate. Interestingly, the proportions of those not eligible for the study, as well as those engaged respondents with 100% response to all core questions, were fairly consistent across stages.
Figure 4. Survey participants by participant type
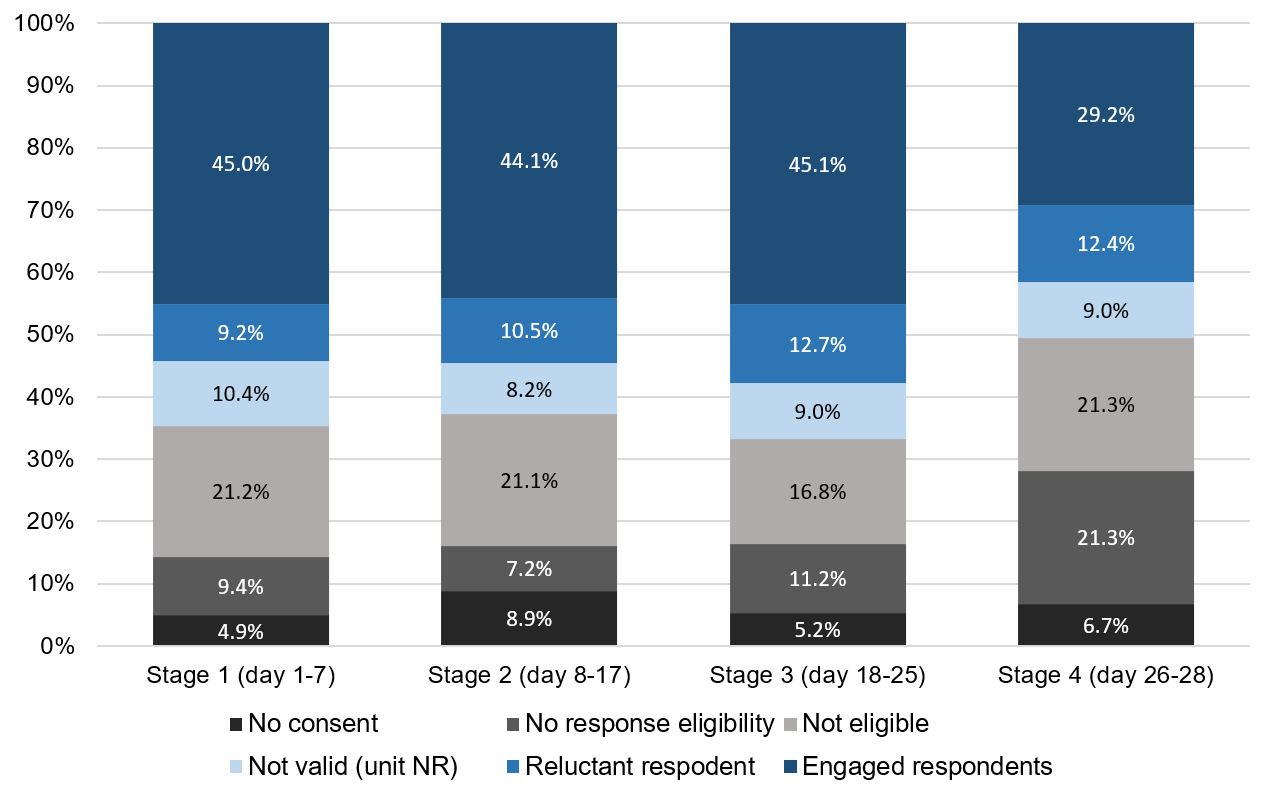
Source: Clickers dataset.
Survey and responses quality
Survey performance by sampling stage
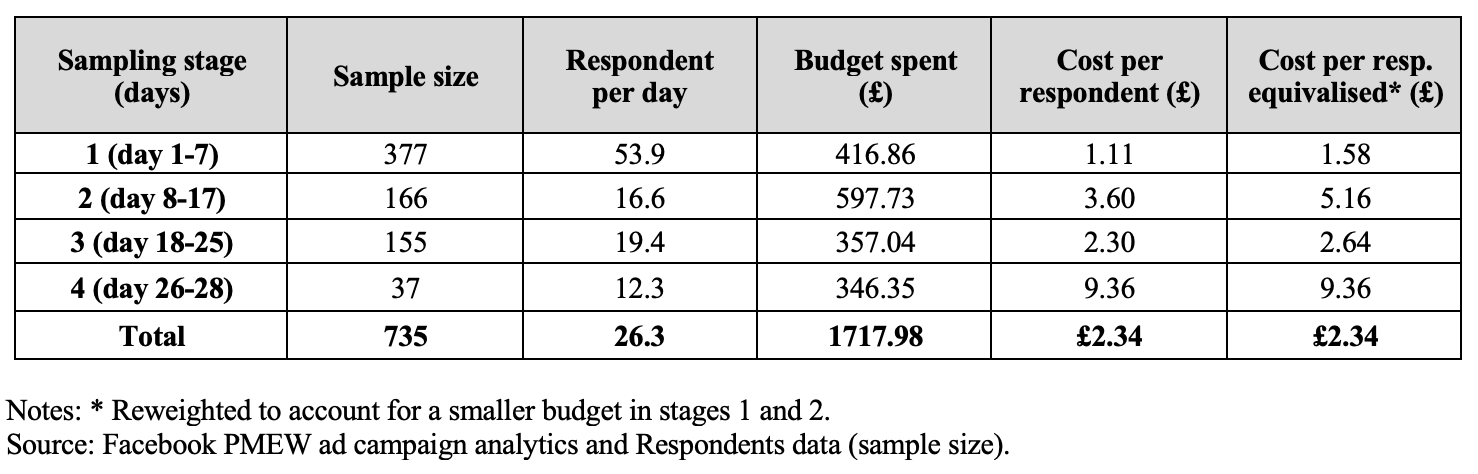
Moving on to exploring the quality of the survey data using the Respondents dataset, we will start by overviewing various outcome indicators by sampling stage. In Table 6 we see that 54% of all respondents were recruited in the first week of sampling. These respondents were also the ‘cheapest’, while the shortest stage 4 and men-only sampling in stage 2 produced more ‘expensive’ respondents. Overall, the cost of one respondent was £2.34 and the lowest in the first week of sampling (£1.11). Excluding stage 4 from the calculations, it would be £1.97. This is still higher than costs per respondent in previous studies of Polish migrants (Pötzschke & Braun (2017) – €0.45 (£0.35); Ryndyk (2021) – NOK 3.66 (£0.30)) which however recruited all occupations.
Table 6. Survey outcome indicators by sampling stage
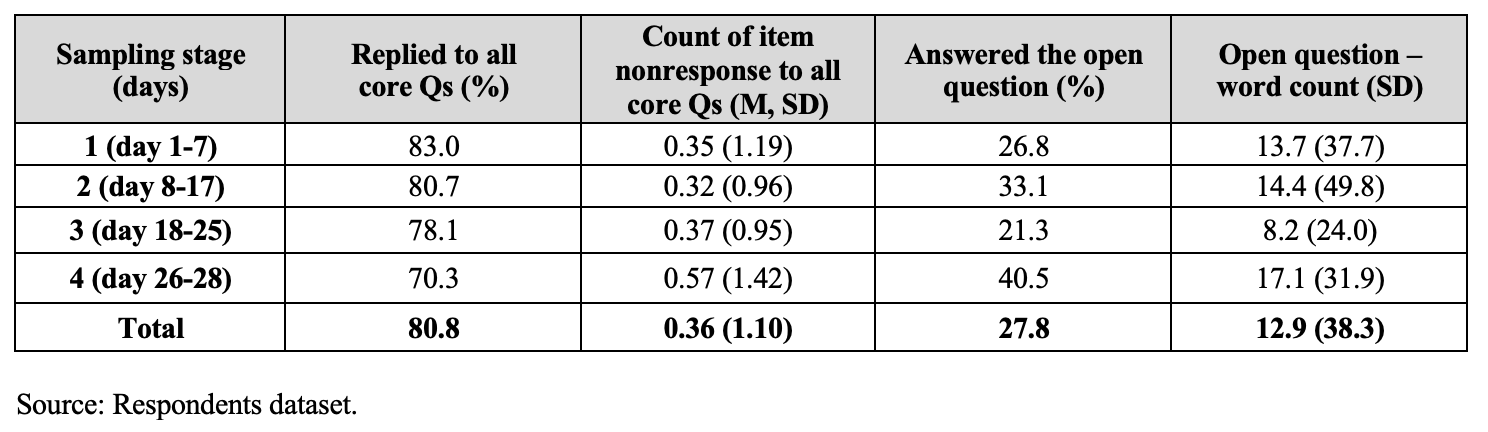
More and easy-to-recruit respondents do not mean more cognitively engaged respondents. Measures of survey quality presented in Table 7 indicate that the largest pool of respondents recruited in stage 1 had the highest full response rate, while those in stage 4 have more data missingness, but more often replied to the open question. The average word count of answers to the open question was 13 words and it was similar to that in Neundorf & Öztűrk’s (2021) study. Respondents in stage 3 provided shortest responses, while in stage 4 – longest.
Table 7. Response quality indicators by sampling stage
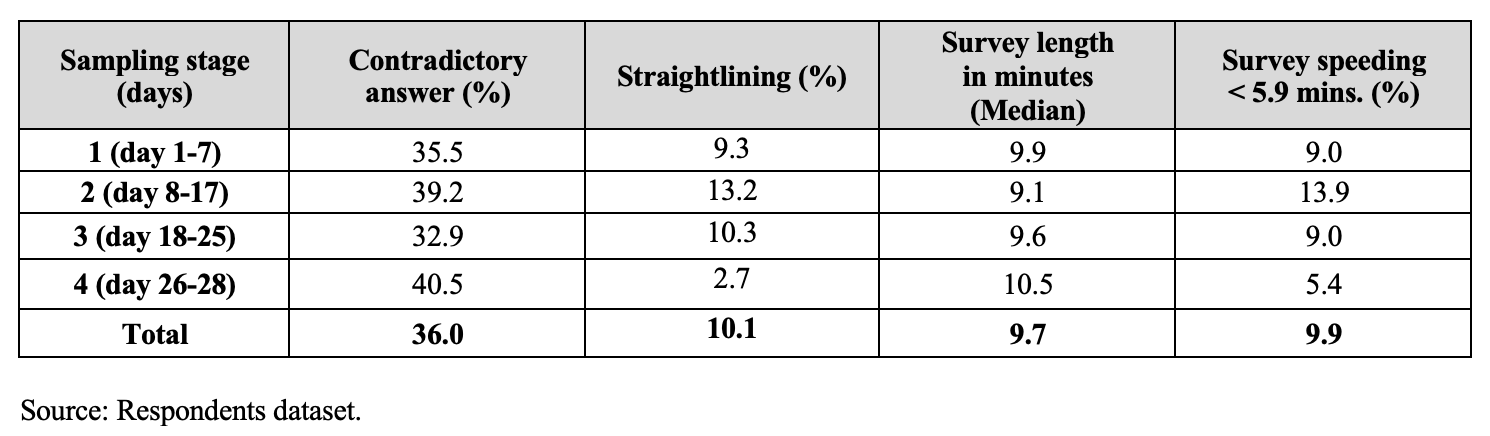
In terms of respondent attentiveness, as illustrated in Table 8, the picture is less straightforward. Overall, the proportion of inconsistent answers to the questions on workplace discrimination was fairly high (36%), indicating that many respondents were confused by the reversed scale for this item. The smallest group of respondents in stage 4 had the highest proportion of contradictory answers, but the lowest incidence of straightlining and speeding. Stage 2, in contrast, had the highest proportion of straightliners and survey speeders.
Table 8. Survey satisficing indicators by sampling stage
Sample quality by sampling day and stage
Some of these patterns could be linked to different engagement propensities with Facebook ads related to age, gender or education level (Whitaker et al. 2017). Controlling for these demographics, we developed a series of models presented in Figures 5 and 6 as coefficient plots.
Stage. Overall, the sampling stage was not statistically significantly related to most quality indicators and any satisficing indicators. Compared with respondents from stage 1, those in stage 2 were less cooperative: less likely to answer all core questions and with a higher nonresponse rate. In the case of the open question, stage 3 respondents displayed lower and stage 4 higher propensity to answer it than respondents recruited in stage 1.
Day. Facebook campaign duration in days was negatively associated with respondents being fully engaged and providing 100% response to all core questions, that is respondents recruited earlier were more likely to respond fully to all core questions, while those recruited later had a higher rate of item nonresponse.
Stage day. The results by day of stage are in line with the results for the campaign day for indicators of response propensity: respondents recruited earlier in a stage were more likely to answer all core questions and had a lower nonresponse rate. In the case of the word count in the open question, those who came in later in a stage wrote longer responses.
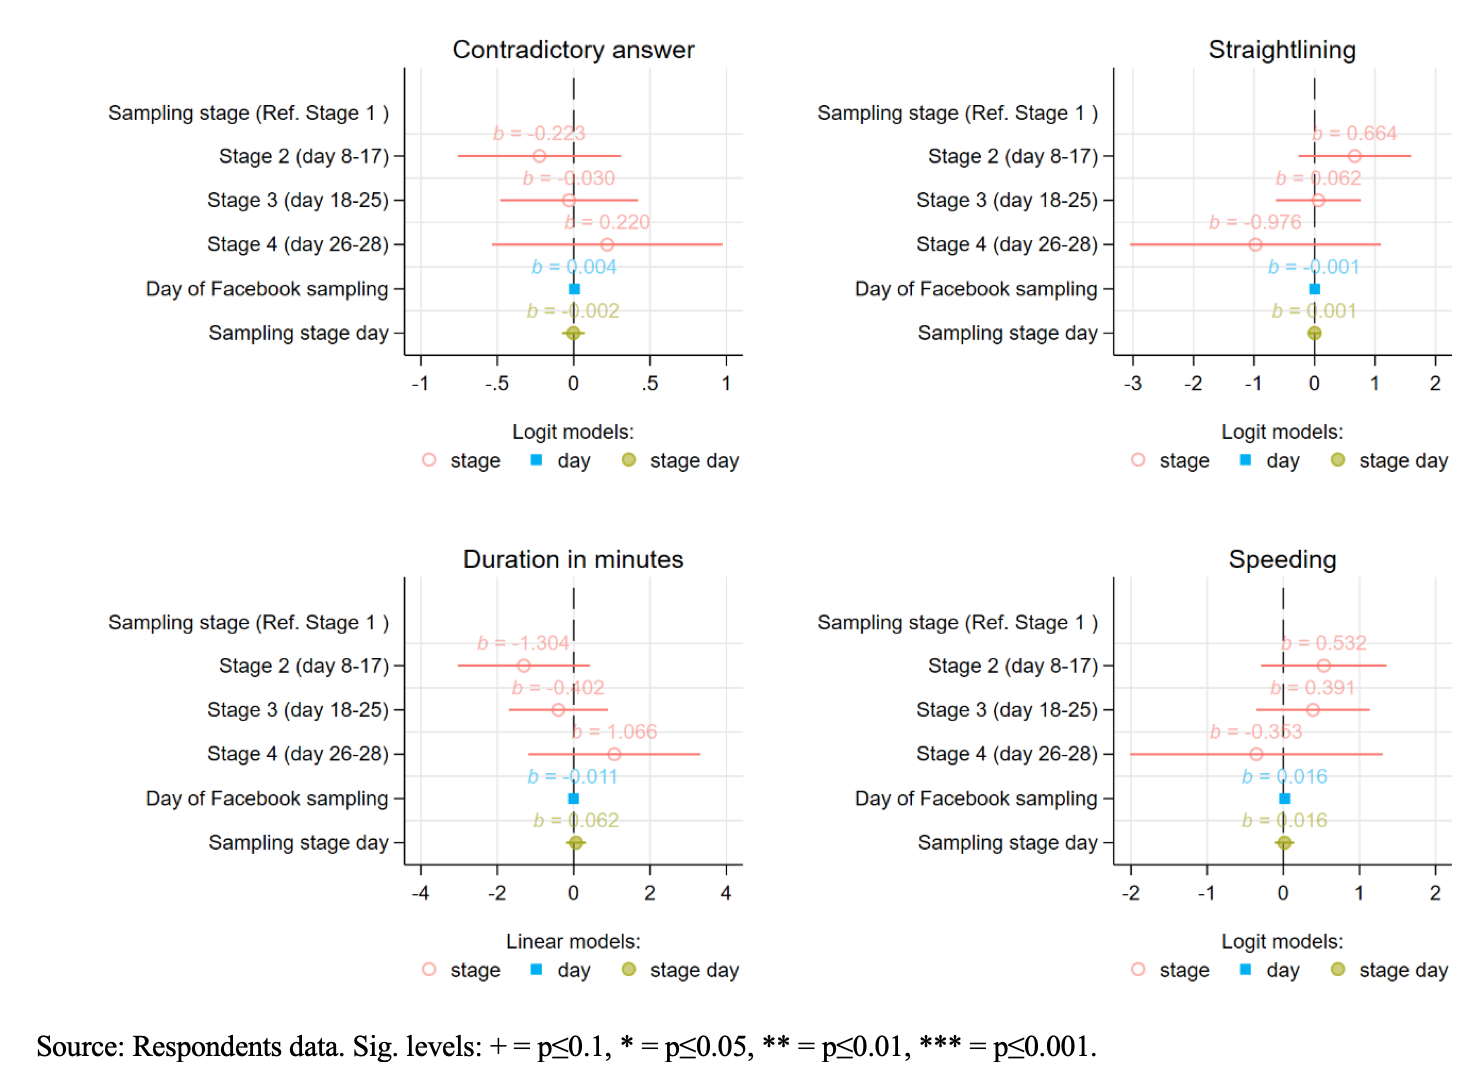
In sum, there is some evidence that the quality of responding differed across time of the Facebook ad campaign and respondents recruited earlier in the survey or earlier in a sampling stage were more reliable in responding to the key survey questions. However, almost none of the time variables were found to be significant predictors of the survey satisficing items, such as inconsistent responding, straightlining and survey speeding.
Figure 5. Models predicting survey quality
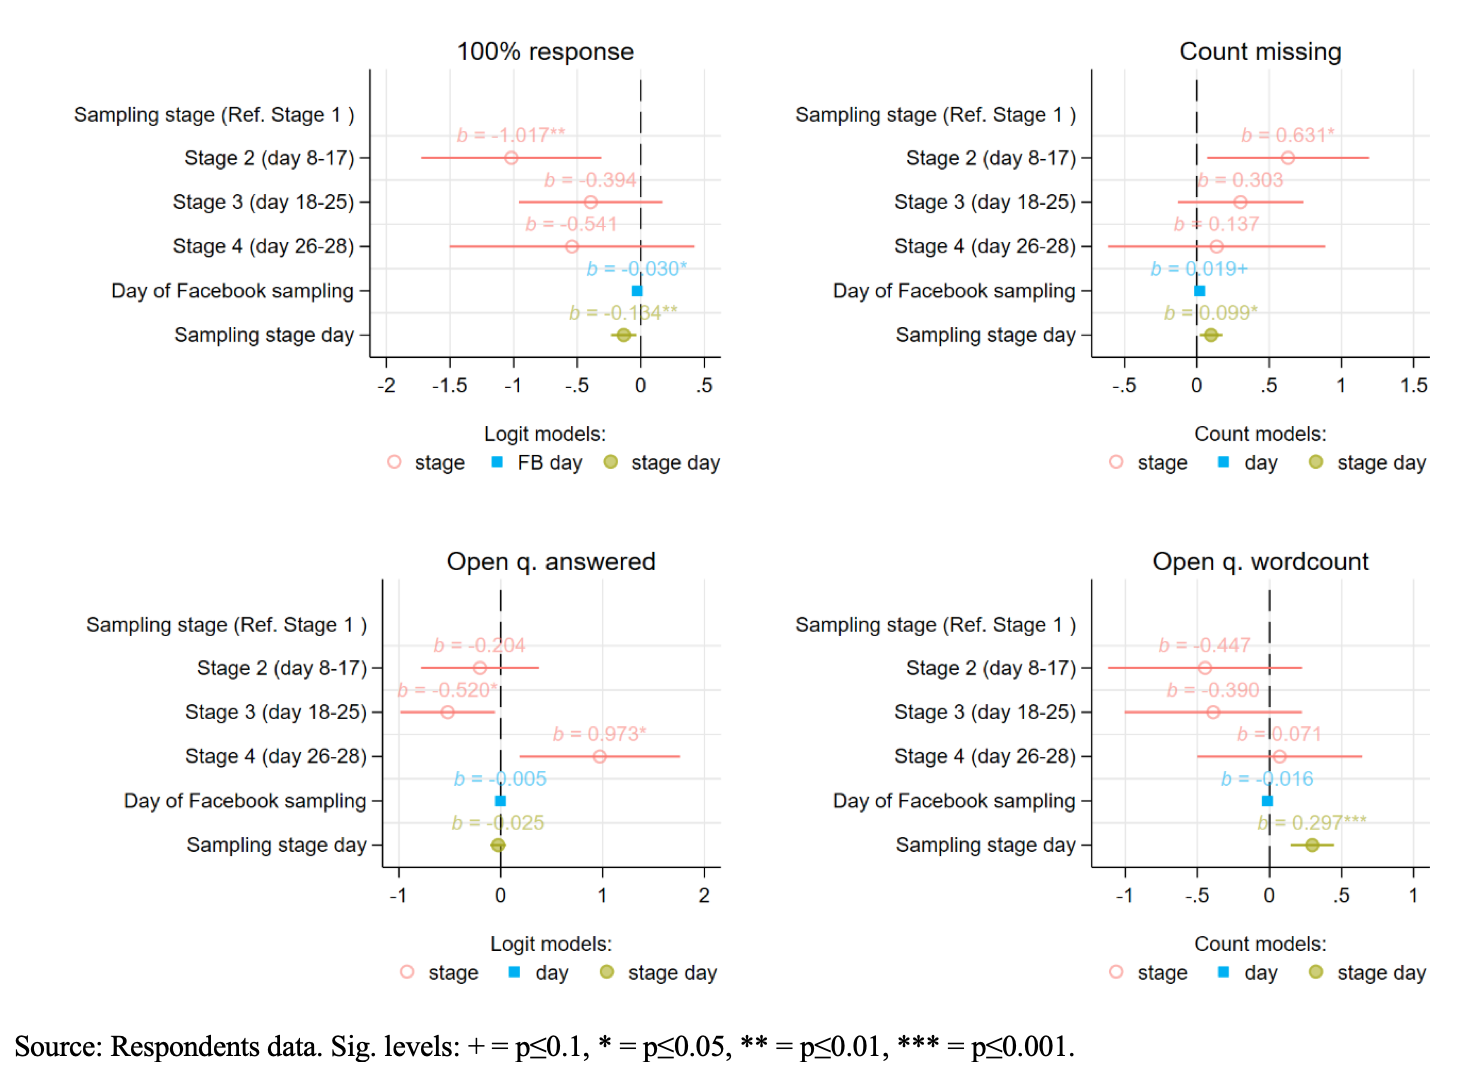
Figure 6. Models predicting survey satisficing
Survey estimates, robustness check and validation
We repeated the same models for several survey measures and report the results in Figures A5 and A6 (Appendix). There are no large differences in terms of survey estimates about participants’ behaviours or attitudes across the ad campaign/fieldwork. Because our four sampling stages are not fully comparable (Facebook ad algorithm is likely to work differently after changing the campaign settings), we also experimented with models where stage was introduced together with stage day, and the results remained the same.
Another way to validate the results would be to compare the profile of participants against external benchmark data. We made some comparisons in Table A1 in the Appendix; however, the data we have is either for all Polish people living in or for all essential workers in the UK, so is not directly comparable. External data validation will be possible once more detailed population census 2021 data for all UK countries is released.
Discussion
This article discusses sampling effectiveness and sample quality from fielding a survey via Facebook ads; how the ad campaign performed over time and whether respondents differed in their behaviour. The analysis of the campaign performance shows that the pool of potential respondents changed over time. The recruitment effectiveness (Facebook clicks) and conversion rate (surveys started) fell over time, until we added extra budget. After ‘using up’ the pool of more cooperative participants (Grow et al. 2020), respondents who were more reluctant to participate in later sampling stages were more ‘expensive’. Facebook users recruited earlier to the survey had the highest conversion rate, were more often eligible to take part and were most likely to be more engaged respondents. Yet, when only survey participants are considered, all three initial stages (stages 1–3, days 1-25) performed equally well across these indicators. So, while it gets harder to get people interested in a survey invitation (the ad) over time, their conversion rate to become a respondent was fairly stable once they interacted with the survey page. This was not the case for the last short, 3-day stage 4 (days 26-28), which did not work well.
We tested whether the sampling stage resulted in recruiting respondents of more- or less-desirable behaviours, such as carelessness, low engagement, satisficing. While our indicators of satisficing do not vary substantially across sampling stages, we found some evidence that campaign day, as well sampling stage day, correlated with lower quality responding. Namely, responding to all core questions and lower item nonresponse were more likely among respondents recruited in the earlier stages of each sampling stage. This might indicate that re-starting sampling refreshes the pool of potential respondents, and it might be beneficial for response quality to stop and start the Facebook ad campaign, forcing the algorithm to learn again. In this respect, it might be useful to think about online sampling using this social media in a different way. For example, instead of running a survey and an associated Facebook ad campaign within a fixed fieldwork period, i.e., for a few consecutive weeks, it could be run for a few shorter times. Stopping and restarting a Facebook ad campaign might give access to a new pool of more cooperative users, slow down the selection bias that the ad algorithm logic relies on, and improve response quality.
Our study has limitations. First, it is not known to researchers how exactly the Facebook algorithm works and whether it was changed during our ad campaign affecting the recruitment and survey quality over time. Second, we do not know how other campaigns which ran at that time might have affected our recruitment either. It would be beneficial in future research to employ an experimental design (Neundorf & Öztűrk 2023) and run a few campaigns of different length and specifications, so that the quality and representativeness of samples obtained can be compared.
Appendix
References
- Bates, N., & Creighton, K. (2000, August). The Last Five Percent: What Can We Learn from Difficult/Late Interviews? In: Proceedings of the Section on Government Statistics (pp. 120-125). Washington DC: US Census Bureau. Retrieved from: https://nces.ed.gov/FCSM/pdf/IHSNG_asa2000proceedings.pdf.
- Billiet, J., Philippens, M., Fitzgerald, R., & Stoop, I. (2007). Estimation of nonresponse bias in the European Social Survey: Using information from reluctant respondents. Journal of Official Statistics, 23(2), 135-162. Retrieved from: https://www.europeansocialsurvey.org/sites/default/files/2023-06/estimation-of-nonresponse-bias-in-the-european-social-survey-using-i.pdf.
- Borg, I., & Tuten, T. L. (2016). Early versus later respondents in intranet-based, organizational surveys. Journal of Behavioral and Applied Management, 4(2), 135-156. Retrieved from: https://jbam.scholasticahq.com/article/1069-early-versus-later-respondents-in-intranet-based-organizational-surveys.
- Borodovsky, J. T., Marsch, L. A., & Budney, A. J. (2018). Studying cannabis use behaviors with Facebook and web surveys: methods and insights. JMIR Public Health and Surveillance, 4(2), e48. https://doi.org/10.2196/publichealth.9408.
- Choi, I., Milne, D. N., Glozier, N., Peters, D., Harvey, S. B., & Calvo, R. A. (2017). Using different Facebook advertisements to recruit men for an online mental health study: Engagement and selection bias. Internet Interventions, 8, 27-34. https://doi.org/10.1016/j.invent.2017.02.002.
- Elçi, E., Kirisçioglu, E., & Üstübici, A. (2021). How COVID‐19 financially hit urban refugees: evidence from mixed‐method research with citizens and Syrian refugees in Turkey. Disasters, 45, S240-S263. https://doi.org/10.1111/disa.12498.
- Ersanilli, E. & Van der Gaag, M. (2020). “Data report: online surveys. Wave 1”. MOBILISE Working Papers. Version 5. Preprint: https://osf.io/79gca.
- Farr, D. E., Battle, D. A., & Hall, M. B. (2022). Using Facebook Advertisements for Women’s Health Research: Methodology and Outcomes of an Observational Study. JMIR Formative Research, 6(1), e31759. https://doi.org/10.2196/31759.
- Fitzgerald, R., & Fuller, L. (1982). I hear you knocking but you can’t come in: the effects of reluctant respondents and refusers on sample survey estimates. Sociological Methods & Research, 11(1), 3-32. https://doi.org/10.1177/0049124182011001001.
- Fuchs, J. (2020). How Facebook Ads Have Evolved [+ What This Means for Marketers]. Online: https://blog.hubspot.com/marketing/history-facebook-adtips-slideshare (viewed 05/10/2022).
- Gawlewicz, A., Narkowicz, K., Piekut, A., Trevena, P., & Wright, S. (2024). ‘They made bets that I’d die’: Impacts of COVID-19 on Polish essential workers in the UK. Journal of Ethnic and Migration Studies, 50(2), 442-460. https://doi.org/10.1080/1369183X.2023.2249620.
- Green, K. E. (1991). Reluctant respondents: Differences between early, late, and nonresponders to a mail survey. Journal of Experimental Education, 59(3), 268–276. https://doi.org/10.1080/00220973.1991.10806566.
- Grow, A., Perrotta, D., Del Fava, E., Cimentada, J., Rampazzo, F., Gil-Clavel, S., & Zagheni, E. (2020). Addressing Public Health Emergencies via Facebook Surveys: Advantages, Challenges, and Practical Considerations. Journal of Medical Internet Research, 22(12), e20653. https://doi.org/10.2196/20653.
- Iannelli, L., Giglietto, F., Rossi, L., & Zurovac, E. (2020). Facebook digital traces for survey research: Assessing the efficiency and effectiveness of a Facebook Ad–based procedure for recruiting online survey respondents in niche and difficult-to-reach populations. Social Science Computer Review, 38(4), 462-476. https://doi.org/10.1177/0894439318816638.
- Irani, T. A., Gregg, J. A., & Telg, R. (2004). Choosing to use the Web: Comparing early and late respondents to an online web-based survey designed to assess IT computer skills perceptions of county extension agents. Journal of Southern Agricultural Education Research, 54(1), 168-179. Retrieved from: http://www.jsaer.org/pdf/Vol54/54-01-168.pdf.
- Kaminska, O., McCutcheon, A. L., & Billiet, J. (2010). Satisficing among reluctant respondents in a cross-national context. Public Opinion Quarterly, 74(5), 956-984. https://doi.org/10.1093/poq/nfq062.
- Krosnick, J. A. (1991). Response Strategies for Coping with the Cognitive Demands of Attitude Measures in Surveys. Applied Cognitive Psychology 5, 213-236. https://doi.org/10.1002/acp.2350050305.
- Kreuter, F., Müller, G., & Trappmann, M. (2014). A note on mechanisms leading to lower data quality of late or reluctant respondents. Sociological Methods & Research, 43(3), 452-464. https://doi.org/10.1177/0049124113508094.
- Kühne, S. & Zindel, Z. (2020). Using Facebook and Instagram to Recruit Web Survey Participants: A Step-by-Step Guide and Application. Survey Methods: Insights from the Field, Special issue: ‘Advancements in Online and Mobile Survey Methods’. Retrieved from https://surveyinsights.org/?p=13558. https://doi.org/10.13094/SMIF-2020-00017.
- Lynn, P., & Clarke, P. (2002). Separating refusal bias and non‐contact bias: evidence from UK national surveys. Journal of the Royal Statistical Society: Series D (The Statistician), 51(3), 319-333. https://doi.org/10.1111/1467-9884.00321.
- Neundorf, A., & Öztűrk, A. (2021). Recruiting Research Participants through Facebook: Assessing Facebook Advertisement Tools. Preprint: https://osf.io/3g74n/.
- Neundorf, A.,& Öztűrk, A. (2023). How to improve representativeness and cost-effectiveness in samples recruited through Meta: A comparison of advertisement tools. PLoS ONE 18(2): e0281243. https://doi.org/10.1371/journal.pone.0281243.
- Office for National Statistics (ONS), Social Survey Division (2020a). Annual Population Survey, January – December, 2019. [Data Collection]. 4th Edition. UK Data Service. SN: 8632, http://doi.org/10.5255/UKDA-SN-8632-4.
- Office for National Statistics (ONS) (2020b). Coronavirus and key workers in the UK. ONS website. Released 15 May 2020. Retrieved from: https://www.ons.gov.uk/employmentandlabourmarket/peopleinwork/earningsandworkinghours/articles/coronavirusandkeyworkersintheuk/2020-05-15.
- Office for National Statistics (ONS) (2021). Population of the UK by country of birth and nationality. ONS website. Released 25 September 2021. Retrieved from: https://www.ons.gov.uk/peoplepopulationandcommunity/populationandmigration/internationalmigration/datasets/populationoftheunitedkingdombycountryofbirthandnationality.
- Office for National Statistics (ONS) (2022). International migration, England and Wales: Census 2021. ONS website. Released 2 November 2022. Retrieved from: https://www.ons.gov.uk/peoplepopulationandcommunity/populationandmigration/internationalmigration/bulletins/internationalmigrationenglandandwales/census2021.
- Olamijuwon, E. O. (2021). Characterizing low effort responding among young African adults recruited via Facebook advertising. PLoS ONE, 16(5), e0250303. https://doi.org/10.1371/journal.pone.0250303.
- Piekut, A., Gawlewicz, A., Narkowicz, K., Wright, S., Trevena, P., & Le, T. P. L. (2023). Polish Migrant Essential Workers in the UK during COVID-19: Survey Data, 2021. [Data Collection]. Sheffield: The University of Sheffield. https://doi.org/10.15131/shef.data.23739624.
- Pötzschke, S. (2022). Using the innovative to improve the established: The employment of social networking sites as recruitment tools in migrant surveys. International Migration, 60(2), 261-265. https://doi.org/10.1111/imig.12987.
- Pötzschke, S., & Braun, M. (2017). Migrant sampling using Facebook advertisements: A case study of Polish migrants in four European countries. Social Science Computer Review, 35(5), 633-653. https://doi.org/10.1177/0894439316666262.
- Pötzschke, S., & Weiß, B. (2020). Employing Social Networking Sites in migration research: Preliminary findings of the German Emigrants Overseas Online Survey. Preprint: https://osf.io/wnc4b.
- Rampazzo, F., Bijak, J., Vitali, A., Weber, I., & Zagheni, E. (2021). A framework for estimating migrant stocks using digital traces and survey data: An application in the United Kingdom. Demography, 58(6), 2193-2218. https://doi.org/10.1215/00703370-9578562.
- Rao, K., & Pennington, J. (2013). Should the third reminder be sent? The role of survey response timing on web survey results. International Journal of Market Research, 55(5), 651-674. https://doi.org/10.2501/IJMR-2013-056.
- Rosenzweig, L. R., Bergquist, P., Hoffmann Pham, K., Rampazzo, F., & Mildenberger, M. (2020, October 15). Survey sampling in the Global South using Facebook advertisements. Preprint: https://osf.io/dka8f.
- Ryndyk, O. (2020). The role of labour market integration in migrants’ decisions about family reunification: a comparative study of Polish migrants in Norway, Sweden, and the UK. Comparative Migration Studies, 8(1), 1-18. https://doi.org/10.1186/s40878-020-00177-2.
- Ryndyk, O. (2021). The Language-Based Recruitment of Migrants to Online Surveys with Facebook Advertisements: A Comparative Assessment from Three Geographical Contexts. Central and Eastern European Migration Review, 10(2), 131-149. https://doi.org/10.17467/ceemr.2021.13.
- Scottish Government (2020). Coronavirus (COVID-19): prioritisation matrix for key workers to be tested. Released 11 May 2020. Retrieved from: https://www.gov.scot/publications/coronavirus-covid-19-access-to-testing/
- Sigman, R., Lewis, T., Yount, N. D., & Lee, K. (2014). Does the length of fielding period matter? Examining response scores of early versus late responders. Journal of Official Statistics, 30(4), 651. https://doi.org/10.2478/jos-2014-0042.
- Stern, M. J., Bilgen, I., McClain, C., & Hunscher, B. (2017). Effective sampling from social media sites and search engines for web surveys: Demographic and data quality differences in surveys of Google and Facebook users. Social Science Computer Review, 35(6), 713-732. https://doi.org/10.1177/0894439316683344.
- Struminskaya, B., & Gummer, T. (2022). Risk of nonresponse bias and the length of the field period in a mixed-mode general population panel. Journal of Survey Statistics and Methodology, 10(1), 161-182. https://doi.org/10.1093/jssam/smab011.
- Sturgis, P., Williams, J., Brunton-Smith, I., & Moore, J. (2017). Fieldwork effort, response rate, and the distribution of survey outcomes. A multilevel meta-analysis. Public Opinion Quarterly, 81(2), 523-542. https://doi.org/10.1093/poq/nfw055.
- UK Government, 8 January 2020, Children of critical workers and vulnerable children who can access schools or educational settings. Retrieved from: https://www.gov.uk/government/publications/coronavirus-covid-19-maintaining-educational-provision/guidance-for-schools-colleges-and-local-authorities-on-maintaining-educational-provision
- Tourangeau, R., Groves, R. M., & Redline, C. D. (2010). Sensitive topics and reluctant respondents: Demonstrating a link between nonresponse bias and measurement error. Public Opinion Quarterly, 74(3), 413-432. https://doi.org/10.1093/poq/nfq004.
- Whitaker, C., Stevelink, S., & Fear, N. (2017). The use of Facebook in recruiting participants for health research purposes: a systematic review. Journal of Medical Internet Research, 19(8), e290. https://doi.org/10.2196/jmir.7071.
- Wright, S., Gawlewicz, A., Narkowicz, K., Piekut, A. & Paulina, T. (2023). Polish Migrant Essential Workers in the UK during COVID-19: Qualitative Data, 2021. [Data Collection]. Colchester, Essex: UK Data Service. https://dx.doi.org/10.5255/UKDA-SN-856576.
- Yan, T., Tourangeau, R., & Arens, Z. (2004). When less is more: Are reluctant respondents poor reporters. In: JSM Proceedings, Survey Research Methods Section. Alexandria, VA: American Statistical Association (Vol. 984, pp. 4632-4651). Retrieved from: http://www.asasrms.org/Proceedings/y2004/files/Jsm2004-000169.pdf.
- Zhang, B., Mildenberger, M., Howe, P. D., Marlon, J., Rosenthal, S. A., & Leiserowitz, A. (2020). Quota sampling using Facebook advertisements. Political Science Research and Methods, 8(3), 558-564. https://doi.org/10.1017/psrm.2018.49.
-
Keywords
calibration CATI coverage coverage bias cross-national surveys data linkage data quality European Social Survey experiment face-to-face face-to-face survey Facebook hard to reach populations incentives item nonresponse measurement measurement error mixed-mode surveys multitasking non-probability samples Nonresponse nonresponse bias nonresponse rates paradata PIAAC Probability sample probability samples QR codes rare populations response rate Satisficing social desirability Social media survey survey-taking climate survey data survey management survey methods Telephone survey telephone surveys total survey error unit nonresponse validity web survey Web surveys weighting
