

Effects of mode and incentives on response rate, sample composition, and costs – experience from a self-administered mixed-mode survey of movers
Manuela Schmidt  University of Bonn, Germany
Alice Barth University of Bonn, Germany
Jörg Blasius - University of Bonn, Germany
Schmidt M., Barth A. & Blasius J. (2025). Effects of mode and incentives on response rate, sample composition, and costs – experience from a self-administered mixed-mode survey of movers. Survey Methods: Insights from the Field. Retrieved from https://surveyinsights.org/?p=?p=19802.
© the authors 2025. This work is licensed under a Creative Commons Attribution 4.0 International License (CC BY 4.0) 
Abstract
Using incentives to reduce unit nonresponse in surveys is an established practice, with prepaid incentives being particularly effective in increasing participation rates. In this paper, we investigate how incentives affect participation rates and sample composition in an offline-recruited mixed-mode survey (concurrent paper/web and push-to-web), using an experimental design. We conducted a survey on residential satisfaction and reasons for moving place, sampling residents who moved away from two urban neighborhoods in Cologne, Germany, between 2018 and 2022. Addresses were provided by Cologne’s Office for Urban Development and Statistics, including information on the residents’ age and gender. Of a random sample of 3,000 persons, 2,000 received a postal invitation to participate in a web survey (push-to-web), while 1,000 received a printed questionnaire with prepaid return envelopes and the option to participate online (concurrent). In each group, 500 participants were randomly assigned a prepaid monetary incentive of a five-euro banknote. The cooperation rate with incentives was 50.6%, and 26.6% without; the overall cooperation rate was 34.8%. Results show that incentives strongly increased the probability of participation, irrespective of gender and age. Within the sample, incentives enlarged the share of respondents with lower educational levels, lower incomes, and migration backgrounds, which can justify higher costs per response.
Keywords
cost-efficiency, incentives, Response bias, response rate, sample composition
Copyright
© the authors 2025. This work is licensed under a Creative Commons Attribution 4.0 International License (CC BY 4.0)
Introduction
The use of incentives in standardized surveys is an established and effective practice to increase the response rate. As early as the beginning of the 1930s, Shuttleworth (1931, p. 652) could show in “a study on questionnaire technique” that “… the enclosure of a twenty-five cent piece in a mail questionnaire brought 32.4 per cent more replies than the same questionnaire without the coin”. Over the following decades, plenty of studies have demonstrated that incentives have a general positive effect on response rates, especially when (unconditional) prepaid monetary incentives are used (Abdelazeem et al., 2023; Church, 1993; Mercer et al., 2015; Singer & Ye, 2013). While it is often assumed that incentives are particularly effective in the absence of an interviewer, i.e. in self-administered surveys such as mail and web surveys (Göritz, 2006; Ryu et al., 2006), significant effects of incentives on response rate in telephone and face-to-face surveys have also been reported (Singer, van Hoewyk, et al., 1999).
Research on incentives is important against the backdrop of ever-declining response rates; for example, between 2002 and 2018, response rates for the well-established German General Social Survey decreased from 47.3% to 32.3% (until 2018 the survey was conducted face-to-face; Wolf et al., 2021, p. 627). In web surveys, response rates tend to be even lower (Daikeler et al., 2020). Low response rates may compromise the representativeness of the sample, leading to doubts whether generalizable statements can be made from the attained sample (Czajka & Beyler, 2016). While there is no uniform relationship between nonresponse rates and problematic bias in survey estimates, declining response rates have nevertheless led to increased efforts to motivate potential participants, as well as more complexity in survey design and analysis (Peytchev, 2013). Research has widely established incentives’ effectiveness in increasing overall response rates, and it has also been discussed whether incentives can boost the participation of groups otherwise under-represented in survey samples, such as politically disinterested respondents or those with lower educational attainment (Lipps et al., 2022; Ryu et al., 2006).
Incentives can therefore be seen as a potential means to reduce total survey error (Biemer, 2010). The crucial questions regarding incentives are whether the higher costs are recompensed by a larger – and possibly less biased – sample, as well as by faster fieldwork. As such, it is of special interest for survey developers to establish how the use of incentives interacts with other survey design features, for example, the mode of invitation, the frequency of reminders, socio-demographic characteristics of the respondents, and the overall structure of costs (Biemer et al., 2018; Stadtmüller et al., 2023). In Germany, large-scale scientific studies were recently criticized by the federal taxpayers’ association for sending out unconditional prepaid incentives in recruitment letters, as these gifts were declared as “wasting taxpayers’ money” (Beham, 2024; Gallant, 2024; Meinfelder, 2024). While the general effectiveness of incentives in increasing response rates is well established, it is important to assess whether they are “worth it”, both in terms of sample composition and overall survey costs, against the background of such debates.
In the present study, we contribute to the state of research on incentives in survey research by presenting the results of an experimental design in an offline-recruited mixed-mode (concurrent paper/web vs. push-to-web) survey on former residents of two neighborhoods in Cologne, Germany. Building on insights from previous experiments on mode choice and incentives (Biemer et al., 2018; Stadtmüller et al., 2023), we test how effective a prepaid incentive of five euro is in a relatively young, urban sample of recent movers, and how this interacts with invitation schemes (concurrent vs. push-to-web invitation). Our study design is as follows: From a random sample of 3,000 out-movers, 1,000 received the printed version of the questionnaire with a prepaid return envelope and the option to participate online (concurrent), while 2,000 persons received a postal invitation with a QR Code/link to a web survey (push-to-web). In each group, 500 participants were randomly selected to receive a prepaid incentive of a five-euro banknote. We thus have a four-field design comparing the invitation group (concurrent vs. push-to-web) and the inclusion of an incentive. For all 3,000 invitees, information on age and gender is available, allowing for the investigation of a possible effect of incentives on socio-demographic variables.
In the study, we address the following research questions:
- Do incentives differently affect the probability of participation for men and women, and respondents of different age groups? (RQ1)
- Does the invitation group (concurrent vs. push-to-web) affect respondents’ probability of participation, and does it interact with incentives? (RQ2)
- How do incentives affect sample composition, i.e., do they help to include more hard-to-reach groups? (RQ3)
- What are the costs for the different experimental conditions – is it worthwhile to use incentives as a means to boost response rates in terms of cost efficiency? (RQ4)
State of research on incentives in surveys
In general, incentives have been found to increase response rates in a wide range of surveys (Church, 1993; Kephart & Bressler, 1958; Lipps et al., 2022; Ryu et al., 2006; Shuttleworth, 1931; Singer & Ye, 2013; Smith et al., 2019; Wolf et al., 2021). Incentives are given in various forms, such as a prize draw (Porter & Whitcomb, 2003; Singer & Ye, 2013; Warriner et al., 1996), contributions to charities (Warriner et al., 1996), vouchers, lottery tickets (Budowski & Scherpenzeel, 2005; Church, 1993), or small gifts such as pens, stamps, or postcards (Wetzels et al., 2008; White et al., 2005). What has proven most effective in increasing response rates, however, is cash (Kephart & Bressler, 1958; Lipps et al., 2023; Lipps et al., 2022). Another differentiation concerns pre-and postpaid incentives (Church, 1993; Wolf et al., 2021): It has been established that unconditional, prepaid incentives are more effective in raising response rates than promised incentives or lotteries (Pforr et al., 2015; Singer & Ye, 2013). Overall, the payment of cash before the interview has the strongest positive effect on participation, even though the amounts of money are typically fairly small (Hsu et al., 2017). Occasionally, prepaid cash incentives may cause problems, as some respondents are mistrustful concerning the seriousness of an agency that sends unsolicited cash (e.g. Börsch-Supan et al., 2013), but the positive effects far outweigh the negative ones.
There are several theoretical accounts that provide explanations for why incentives motivate respondents to take part in surveys. One prominent explanation is reciprocity: respondents who receive money or a gift feel obliged to return the favor by responding to the survey (Gouldner, 1960). In a similar vein, Dillman (1978) argues – with recourse to social exchange theory – that by offering a (prepaid) incentive, survey organizations demonstrate trust that a potential respondent will comply with the request, thus stimulating cooperation. The leverage-saliency theory of survey participation (Groves et al., 2000) states that different aspects of a survey (such as the topic, organization, or incentive) may appeal to different respondents. Therefore, incentives may be particularly effective in low-income households, or to motivate survey respondents who are not interested in the topic of the survey, lack altruistic motives, or have alternative obligations (Singer, Groves, & Corning, 1999).
In contrast to these theoretical expectations, Eyerman et al. (2005) and Zagorsky and Rhoton (2008) found that a monetary incentive did not affect sample composition with regard to different demographic subgroups. Similarly, an experiment on postpaid incentives in the German General Social Survey (ALLBUS) 2010 showed that, while the incentives improved the overall response, they did not change the sample composition in a significant way regarding indicators of socio-economic status (Blohm & Koch, 2013). Messer and Dillman (2010) found no effect for gender, age, income, and race, but a significant effect of incentives for education, as less educated respondents had higher levels of cooperation in the incentive condition. Similar results are reported by Petrolia and Bhattacharjee (2009) and Ryu et al. (2006). A study on the use of incentives in the German Socio-Economic Panel (GSOEP) demonstrated that monetary incentives lead to a higher contact rate for immigrant households, also having a positive effect on participation in subsequent waves (Schröder et al., 2013). However, a study by Feskens et al. (2008) suggests this positive effect only for immigrants from western countries, while the cooperation rate of participants of non-western background does not improve with a prepaid incentive (in the form of stamps).
In summary, existing research shows that incentives are an effective means of boosting response rates, but the calculation of costs and benefits may vary with the population of interest and the potential error associated with (selective) unit nonresponse, as well as the general survey costs. Kephart and Bressler (1958, p. 123) tested different incentive values (between one penny and a quarter) as well as different methods of mail delivery, to ultimately conclude that “a follow-up letter was just as effective as more expensive and complicated arrangements” in increasing the response rate. Haas et al. (2023) state that incentives should mainly be used when the sample is limited, thus justifying higher per-complete costs. Saunders et al. (2006, p. 1228) argue that in order to minimize overall survey costs, “the optimum monetary incentive was found to be a function of the variable costs of mailing a questionnaire excluding the incentive, the survey response rate with no incentive, and the coefficient for the mail incentive”. In other words, if survey costs are low, the value of the incentive should also be low to prevent a disproportionate increase in costs.
Regarding the cost efficiency of incentives, it is particularly relevant to assess whether the effects of incentives differ between survey modes in order to find the most efficient strategy to increase response rates and avoid systematic nonresponse. Alongside differing cost structures, survey modes also differ in sampling strategies, response rates, and potential errors. While web surveys are usually the cheapest survey option, the drawing of a representative online sample is challenging (Baker et al., 2010). Therefore, many web surveys that aim for representativeness use offline recruitment (via mail or telephone), despite higher costs. The sending of invitations by mail has also been shown to improve the response rate for web surveys (Daikeler et al., 2020; Millar & Dillman, 2011) and enables the use of methods to increase response rates, e.g. the inclusion of cash incentives in the envelope (Manfreda et al., 2008). In addition, studies showed that a concurrent design (i.e., giving respondents the choice between modes, typically paper and web) increases response rates compared to a web-first design or a paper-only design (Cornesse et al., 2022; Holmberg et al., 2010; Wolf et al., 2021). In a study by Campbell et al. (2018), a more expensive mixed-mode (mail/web) approach yielded a response rate of 39%, while the online-only option reached only 4.5%, but seemed to be equally effective with regard to the sample composition.
Wolf et al. (2021) showed that older age groups are likely to choose the paper questionnaire over a web survey. Stadtmüller et al. (2023) found that small prepaid incentives (1 or 2 euro coins) worked better in a concurrent design of a self-administered mixed-mode survey compared to a sequential design. Previous research on survey costs by Biemer et al. (2018) shows that while sending participants both a paper questionnaire and a web link does increase the cost per complete, it also has a positive effect on response rates of about 5 percentage points (from 35% in web only to 40% in concurrent mode). In contrast, Medway and Fulton (2012) argue that incorporating a concurrent web option in mail surveys may actually lower response rates.
Drawing on the state of research, in this paper we want to investigate the effects of a prepaid monetary incentive on participation rates in a sample of a special population: people who have moved away from (or within; that is, they have changed their place of residence) two inner-city neighborhoods in Cologne. The experimental design regarding incentives is complemented by a variation in the mode-choice design of the invitation: concurrent (paper/web) vs. push-to-web. Our sample of movers includes information on the age and gender of all sample members, thus allowing for a test of the effects of incentive and invitation group on the probability of participation in a cross-sectional study (RQ1 & RQ2). Further, we compare the incentivized and non-incentivized sub-samples with regard to the socio-demographic characteristics income, education and migration background (RQ3) and calculate costs for the different experimental conditions (RQ4). As such, we contribute to research on the interplay of incentive schemes and mode-choice design of invitations, and the influence of those factors on response rates and survey costs (Biemer et al., 2018; Stadtmüller et al., 2023) in a young, urban population of movers, using a prepaid monetary incentive of a five euro banknote, which is the smallest incentive value that is commonly used in large-scale surveys in Germany (Blohm & Koch, 2021; Pforr et al., 2015).
In line with previous research, we expect that the use of the incentive of a five-euro banknote sent with the initial invitation will have a positive effect on participation. Furthermore, we expect a higher probability of participation for respondents in the concurrent invitation group, as the paper questionnaire is likely to act as a reminder for participation (Dillman et al., 2014, p. 382; Manfreda et al., 2008) and giving people the choice between participating on paper or online yields higher response rates than web only (Biemer et al., 2018). Drawing on findings of incentives being particularly effective in a concurrent design (Stadtmüller et al., 2023), we also test for an interaction between invitation group and incentive (RQ2).
In terms of age and gender (RQ1), the current state of research does not consistently suggest a direction of effects on participation. We assume, however, that incentives influence sample composition by attracting hard-to-reach groups such as respondents with lower educational levels and income, as well as migrants (RQ3). Finally, we review the costs per complete associated with each experimental condition (RQ4) and reflect on the cost-efficiency of incentives and other design features.
Data and methods
The present study is part of a larger project investigating the process of gentrification in two residential areas close to Cologne’s city center, whose main feature is a panel study where dwellings constitute the units of research. In this dwelling panel, the same dwellings are approached in each wave, and one current resident of each dwelling is interviewed (for the sample design and main research interest, see Friedrichs & Blasius 2015, 2020). While this design provides information on staying residents as well as new in-movers in the sampled dwellings, information on out-movers was hitherto missing. For this reason, we conducted a study focusing on residents who moved out of their dwellings. To provide an adequate sample size, we used a random sample of all out-movers from the two neighborhoods in question between 2018 and 2022, irrespective of whether they had been part of the dwelling panel before.
The current addresses of out-movers, including those who moved within the neighborhoods, along with information on their age and gender, were provided by the city of Cologne’s Office for Urban Development and Statistics. As the overall focus of the research project is on issues of gentrification and displacement, we excluded residents who moved further away than the city’s own commuter belt (Stadt Köln, 2021), as gentrification-induced displacement is expected to happen within local boundaries (Janssen et al., 2023). From a total population of 14,026 out-movers between 2018 and 2022, we drew a random sample comprising n=3,000 persons, who were then randomly assigned into the invitation groups concurrent (n=1,000) and push-to-web (n=2,000). Within each invitation group, n=500 participants were randomly selected to receive a prepaid monetary incentive in the form of a five-euro banknote enclosed with the invitation letter. All invitations were sent to the participants’ postal addresses in June 2023. The letters addressed the topic of the study (life satisfaction in general, satisfaction with participants’ old and new neighborhoods) and informed prospective respondents about their inclusion in the sample based on their recent move from their former neighborhood. The questionnaire comprised about 30 questions – mostly standardized – over 11 pages (print version); it took approximately 12.5 minutes to complete (web version). The administration of the survey, as well as response monitoring and data cleaning, was not outsourced to a field agency, but carried out by the research team itself.
Target persons in the concurrent group received an envelope with the invitation to participate in the interview, a printed questionnaire, and a prepaid return envelope, as well as a link and QR code to the online survey. Target persons in the push-to-web mode received the postal invitation with a link and QR code to the online survey, and were informed that they could order a paper questionnaire and return envelope by contacting our office via phone or email. One reminder with a web link only was sent by mail after four weeks to all persons who had not yet participated, regardless of their initial invitation mode. Neutral losses comprised n=258 persons who were excluded from the random sample due to undeliverable letters (n=214), persons reporting never to have lived in the neighborhoods (n=30), and other neutral drop-out reasons (n=13). In addition, 74 sample members from the push-to-web/no incentive group were excluded from the present study as they received an incentive with the reminder, deviating from the experimental design. In total, 91 five-euro banknotes were sent back, either because of undeliverable mail or (few) active refusals. Data cleaning based on item nonresponse (>50% of sociodemographic and total questions) led to the exclusion of 63 cases, which were nearly equally distributed between incentivized and non-incentivized participants. In total, 928 valid interviews (34.8% cooperation rate, 31.7% response rate, see AAPOR 2023, version 5.1) constitute the basis of our study.
A comparison of the age and gender of participants to official registration data exhibits high reliability, with n=910 (98.1%) of answers on gender matching the registered gender (the survey offered a third gender option, while registration does not); survey answers and registration data on age also correlated strongly, with r=.98.
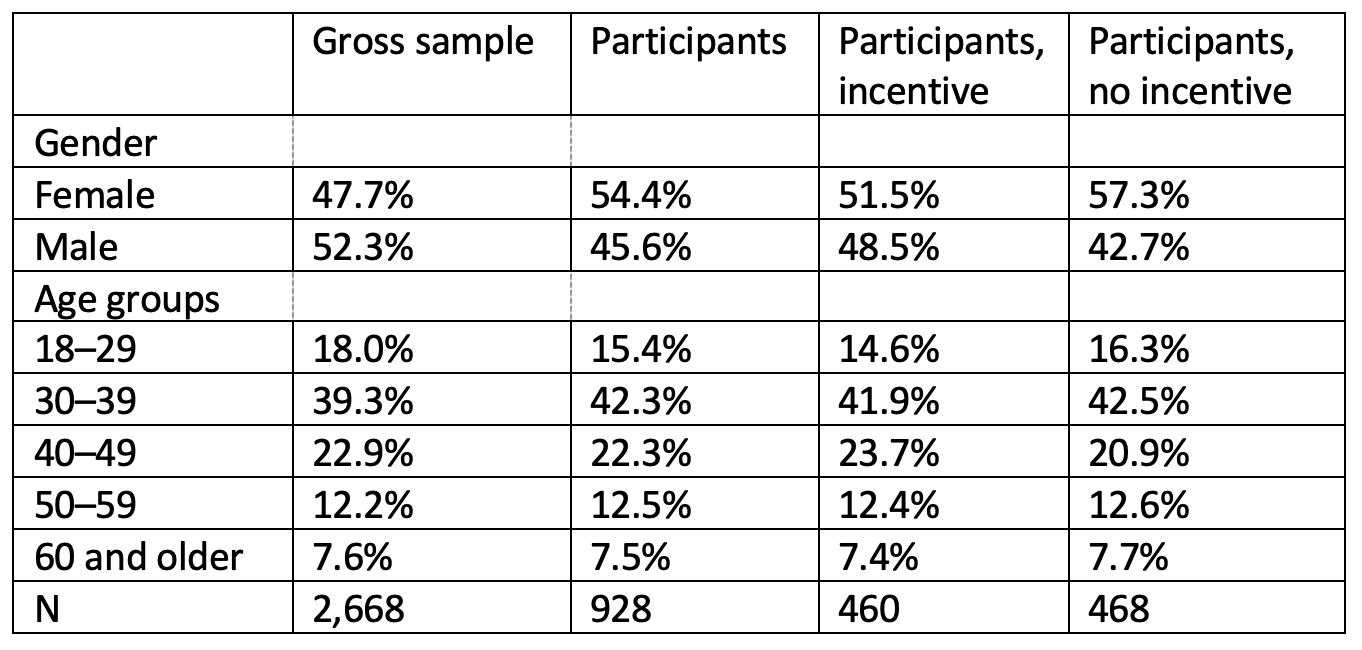
Looking at the socio-demographic composition of the gross sample (n=2,668) and respondents (RQ1), table 1 shows that there is a gender difference between the gross sample (54.5% males) and respondents (45.7% males), suggesting that women had a higher propensity to participate in the study. This gender effect is slightly mitigated in the incentivized group. Regarding age, it is visible that our sample of out-movers is disproportionately young, with less than 10% of persons aged 60 years and older. This reflects the fact that younger persons are more likely to change accommodation (Dieleman, 2001), while there are no substantial age differences between the gross sample and respondents, as well as between incentivized and non-incentivized groups.
Table 1: Socio-demographic composition of gross sample and participants, stratified by incentives
We investigate our research questions by first assessing the individual response rates of each experimental condition (RQ2). The probability of participation by socio-demographic characteristics and their interaction with the use of incentives are then examined in a logistic regression (RQ1 and RQ2). In a further step, we compare incentivized and non-incentivized participants in the sample of respondents only, to assess the effect of incentives on sample composition in terms of educational level, migration background, and household income (RQ3). Finally, a calculation of survey costs is presented to investigate the cost efficiency of the experimental conditions (RQ4).
Results
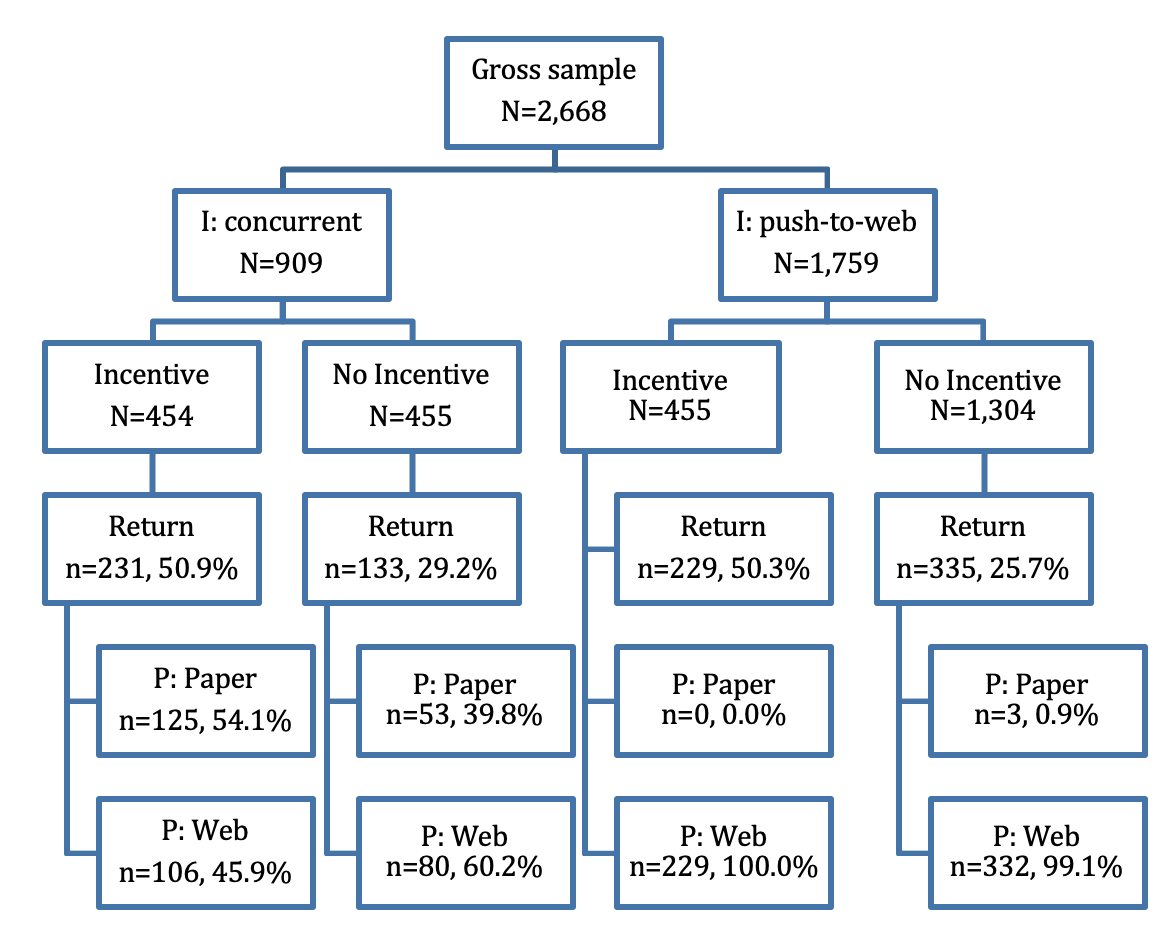
A first insight into the returns by invitation group, use of incentives, and mode of participation (see Fig. 1) shows that the incentives had a strong positive effect on return, almost doubling the return rate in both invitation groups. Respondents in the concurrent group who received an incentive were slightly more likely to return a paper questionnaire (54.1%) than non-incentivized respondents (39.8%).
Figure 1: Cooperation by invitation group, use of incentive, and mode of participation
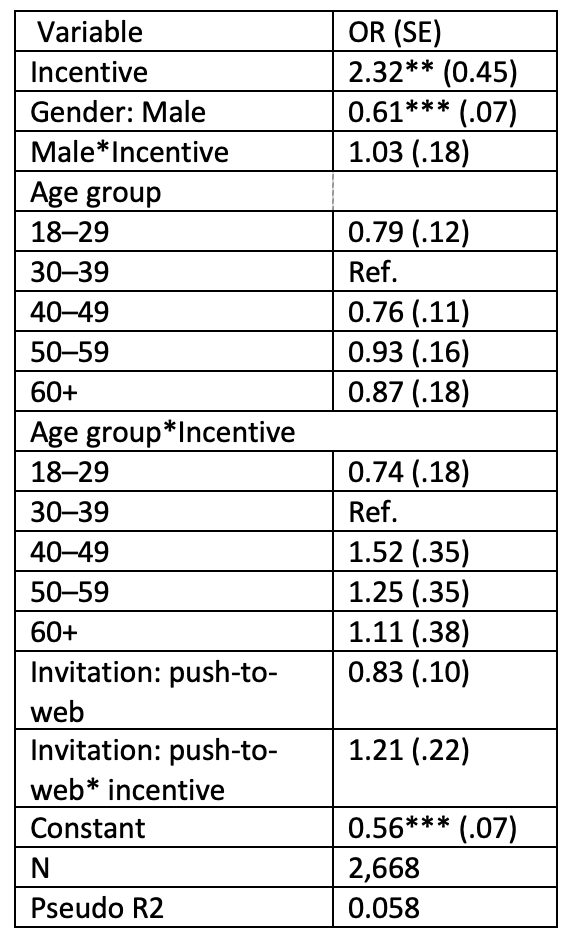
In the next step, we run a logistic regression on the gross sample in order to assess the probability of participation (table 2). Explanatory variables are gender and age according to registration data, as well as the experimental conditions incentive and invitation group (RQ1 and RQ2). We also check interaction effects of incentive with age, gender and invitation group. First, the model confirms the strong effect of incentives on the probability of participation. With an odds ratio of 2.32, incentives more than doubled the probability of participation. Gender has a significant main effect (men are less likely to participate than women) but shows no interaction with incentives. The main effects of age groups do not reach a significant level, neither do their interaction with incentives. The invitation group has, in contrast to our expectations, no effect on participation probability, the interaction with incentive is not significant either.
Table 2: Logistic model on probability of participation
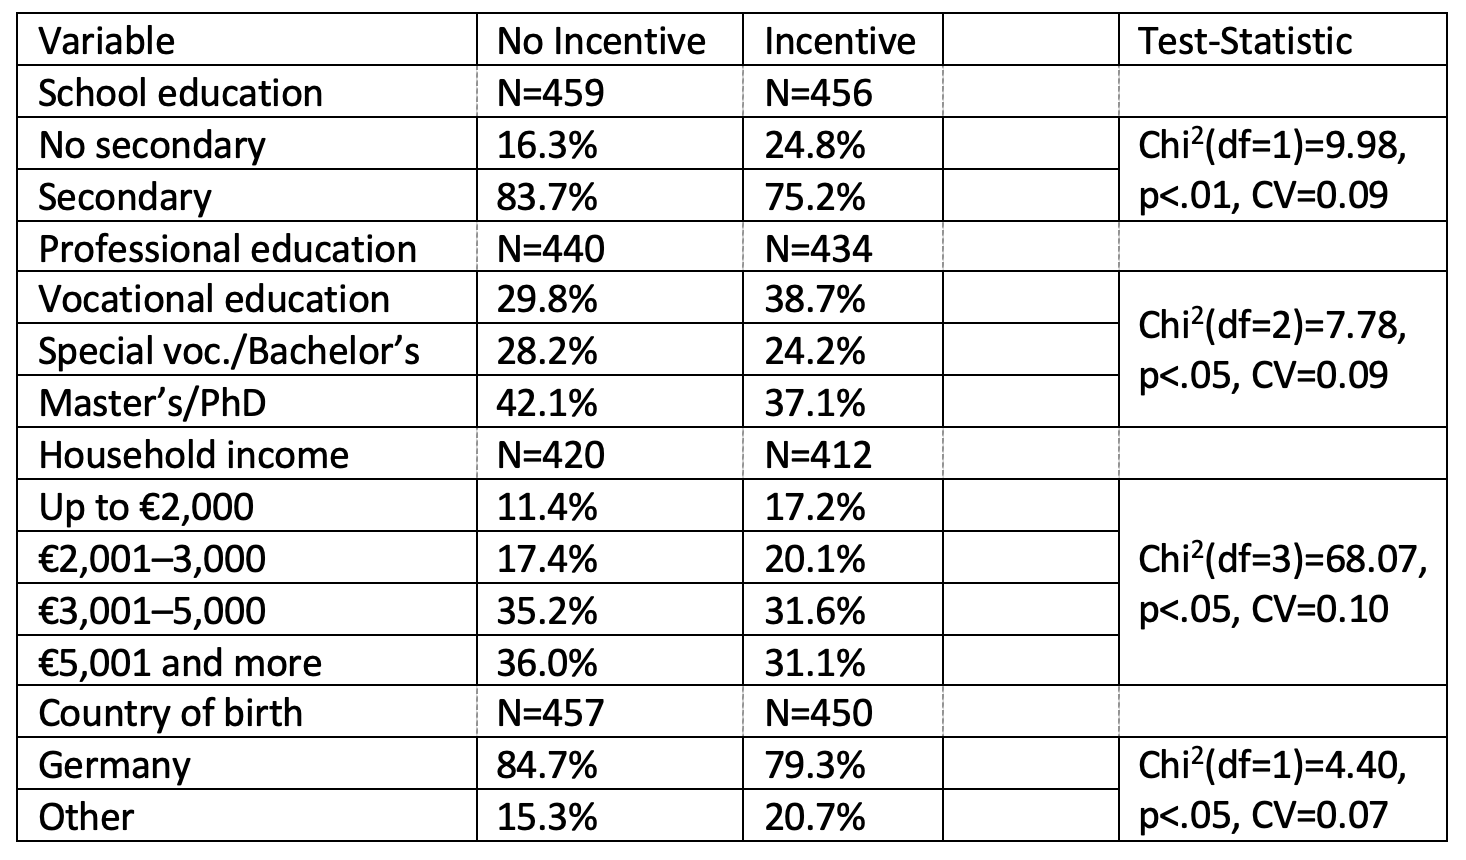
In the next analysis, we restrict our sample to participants only, as further information on socio-demographics is only available from those who took part in the survey. Here, we test the expectation that incentives are effective in increasing the participation of hard-to-reach groups (RQ3). As shown in table 3, in the incentivized group, there is a higher share of participants without secondary education (24.8% in the incentivized group vs. 16.3% in the non-incentivized group). This effect is significant (p<.01) and of small to moderate strength (CV=0.10). The same trend can be seen for the categories of professional-level education, with a higher share of respondents from the lowest category of vocational education in the incentivized group. In addition, the share of low-income households shows a significant (p<.05) relation to incentive. Both the relative share of households in the lowest (up to 2,000 euro per month) and the second-lowest income group (2,001–3,000 euro per month) is higher in the incentivized group. Finally, respondents born outside Germany are also more strongly represented in the incentive group (20.7% vs. 15.3%; p<.05).
Table 3: Share of participants in typically underrepresented groups by incentives
Regarding survey costs (RQ4), we calculate the cost for the mail invitations in the different experimental conditions and one reminder for initial nonrespondents, as well as costs for returned paper questionnaires. In sum, these are the overall survey costs, which we finally break down into costs per complete case in each experimental condition (table 4), oriented to the procedure in Stadtmüller et al. (2023).
The costs of mail invitations are composed of the costs of material (envelopes, paper, printing), postage, and incentives. Indirect survey costs, such as hours worked by the administrative team, were excluded from the analysis2. Invitations in the concurrent mode were about double the price (without incentive) of invitations for the push-to-web group (€1.86 vs. €0.91; mainly due to different postage costs of €1.60 for the larger envelope with paper questionnaire vs. €0.85). Of the 1,000 incentives, 91 were returned when sending the first invitation, mostly due to undeliverable mail; these are subtracted from the total invitation costs in the incentivized groups. After four weeks of field time, a reminder was sent to all participants who had not responded yet, excluding addresses classified as neutral loss. Both concurrent and push-to-web groups received a reminder with a web link only, therefore reminder costs only depend on the number of cases in each group. For the costs per complete case, we additionally differentiate respondents’ mode of participation: mail (sending back a printed questionnaire) vs. web. Each paper questionnaire sent back via mail had an additional postage cost of €1.60.
Table 4: Survey costs
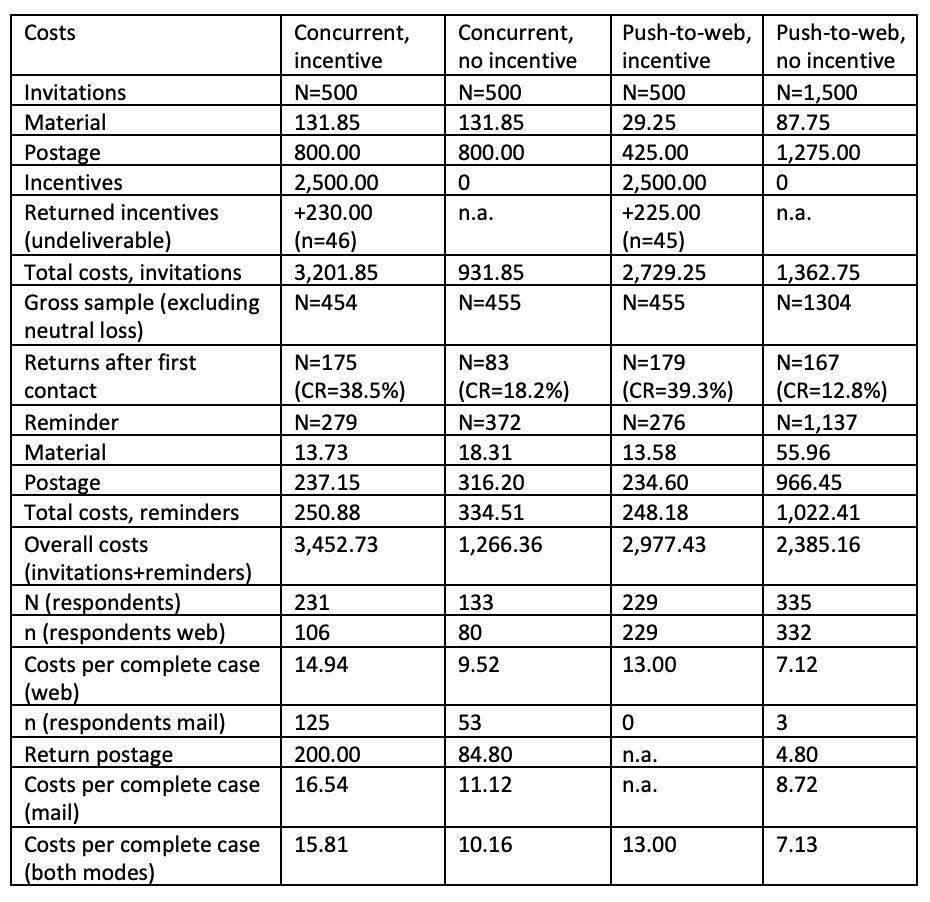
Table 4 shows a cooperation rate of almost 40% after the first contact in the incentivized groups (returns after first contact, line 8). In the non-incentivized target persons, the cooperation rate in the concurrent invitation group (18%) was higher than in the push-to-web condition (13%), which can be interpreted as confirming the assumption that a paper questionnaire has a reminding and valorizing effect, thus increasing the probability of participation.
When looking at overall survey costs, including an incentive of five euro at least doubles the amount of money spent (e.g., in the concurrent group, € 3,452.73 vs. € 1,266.36; in the push-to-web group, the ratio is even higher, but note the three times higher number of cases in the push-to-web + no incentive condition compared to the incentive condition). In terms of costs per complete case, however, this ratio becomes less extreme. Still, the most expensive condition was concurrent + incentive, with an amount of € 15.81, whereas without the incentive, one concurrent complete case caused costs of € 10.16. The cheapest option was the push-to-web + no incentive condition, where a complete case was available at € 7.13. In this calculation, it has to be taken into account that we did not include indirect survey costs, in particular hours worked by the research team. However, it is evident that the extra working time needed to enter the data from the returned paper questionnaires makes the balance even more unfavourable for the concurrent condition.
Conclusion/Discussion
In this paper, we assessed how incentives increased response rates and affected sample composition in a survey of residents moving away from or within two urban neighbourhoods in Germany. In addition, we calculated survey costs in a four-field design – incentive vs. no incentive, concurrent vs. push-to-web invitation – to assess the cost efficiency of different experimental conditions. Our results are in line with previous research in confirming that prepaid cash incentives significantly improve response rate, in our case, including a prepaid incentive of five euros raised response rates from approximately 27% to over 50%.
Our first research question asked whether incentives differently affected the probability of participation for men and women, and respondents of different age groups. We found that compared to the ratio of men and women in the gross sample, women were more likely to participate in the survey. There is, however, no interaction effect of incentive and gender. Regarding the invitation group (RQ2), sending a paper questionnaire with the first invitation letter did slightly increase participation in the non-incentivized group, but the effect was not significant in the multivariate model, neither did the invitation group interact with the incentive effect. We found, however, that in the concurrent group, incentivized participants were more likely to return a paper questionnaire (as opposed to taking part in the online survey). As participation on paper is more costly, due to return postage and data entry, this seems a rather unwanted side effect of the incentives. There is more research needed to find whether this effect is found in other surveys as well, and how it can be explained.
Regarding effects of invitation group, it has to be kept in mind that our sampling frame of people who recently moved from two urban neighbourhoods in Cologne contained less than 10% of respondents of 60 years of age and older. Therefore, a preference of elderly respondents for paper questionnaires, as found in other studies (Seil et al., 2021; Stadtmüller et al., 2023) might not be visible due to a small sample size of aged respondents in our case.
With respect to the sample distribution between incentivized and non-incentivized respondents, there were proportionally more members of hard-to-reach groups in the incentivized subsample (RQ3). This provides support to the mechanism proposed by leverage-saliency theory (Groves et al., 2000): incentives possibly provide an external motivation, thus motivating groups that would not otherwise have participated.
Our last research question (RQ4) referred to the cost-benefit ratio of incentives and invitation group. The calculation of survey costs in the different experimental conditions showed that incentives substantially increased the costs per complete case in both concurrent and push-to-web invitation groups – whether this is an adequate price to pay for the achieved higher representation of hard-to-reach groups is a decision that must be made for each research project. However, the question remains whether lower-value incentives might have a similar effect while being more cost-efficient. It is a limitation of the current study that we only tested a prepaid incentive of a five-euro banknote vs. no incentive, not varying the value or the pay-out mode (prepaid/postpaid/lottery). In a recent study by Stadtmüller et al. (2023), also in an urban setting in Germany, an incentive of a one euro coin had no significant effect on participation, while including a two-euro coin in the invitation letter did significantly increase response rates – however, the increase of three to five percentage points was much less pronounced as compared to our study, where five euro raised the cooperation rate by over 20 percentage points. Further, five euro is a very commonly used incentive value in Germany, as it is the smallest banknote and thus practical to enclose in an envelope. In terms of cost efficiency of the invitation group, including a paper questionnaire did substantially increase costs, whereas the response rate was only slightly (but not significantly) affected. As such, the push-to-web invitation turned out more cost-efficient in our sample of a young, urban target population.
In summary, our study confirms the general positive effect of incentives on response rate. Therefore, we follow the recommendation of Haas et al. (2023) to use incentives, particularly when the base population is limited and over-sampling methods are not unconditionally applicable. In addition, incentives were useful for increasing the participation of hard-to-reach groups.
Endnotes
1 This work was supported by the DFG (German Research Foundation) under grant nr. 457265520.
2 As the fieldwork was carried out by the research team itself, different payment schemes and the team’s intermittent work on this survey’s fielding and other research tasks make it impossible to give valid numbers for these costs.
References
- Abdelazeem, B., Hamdallah, A., Rizk, M. A., Abbas, K. S., El-Shahat, N. A., Manasrah, N., Mostafa, M. R., & Eltobgy, M. (2023). Does usage of monetary incentive impact the involvement in surveys? A systematic review and meta-analysis of 46 randomized controlled trials. PloS One, 18(1), e0279128. https://doi.org/10.1371/journal.pone.0279128
- Baker, R., Blumberg, S. J., Brick, J. M., Couper, M. P [M. P.], Courtright, M., Dennis, J. M., Dillman, D., Frankel, M. R., Garland, P., Groves, R. M [R. M.], Kennedy, C., Krosnick, J., Lavrakas, P. J., Lee, S., Link, M., Piekarski, L., Rao, K., Thomas, R. K., & Zahs, D. (2010). Research Synthesis: AAPOR Report on Online Panels. Public Opinion Quarterly, 74(4), 711–781. https://doi.org/10.1093/poq/nfq048
- Beham, S. (2024, March 19). Bargeld in Briefen: RKI sucht Probanden – und erntet Kritik. BR24, 2024. https://www.br.de/nachrichten/deutschland-welt/rki-verschickt-5-euro-scheine-und-wirbt-um-teilnehmer,U7U4v6V
- Biemer, P. P. (2010). Total Survey Error: Design, Implementation, and Evaluation. Public Opinion Quarterly, 74(5), 817–848. https://doi.org/10.1093/poq/nfq058
- Biemer, P. P., Murphy, J., Zimmer, S., Berry, C., Deng, G., & Lewis, K. (2018). Using Bonus Monetary Incentives to Encourage Web Response in Mixed-Mode Household Surveys. Journal of Survey Statistics and Methodology, 6(2), 240–261. https://doi.org/10.1093/jssam/smx015
- Blohm, M., & Koch, A. (2013). Respondent Incentives in a National Face-to-Face Survey: Effects on Outcome Rates, Sample Composition and Fieldwork Efforts. Methods, Data, Analyses, 7(1), 89–122. https://doi.org/10.12758/mda.2013.004
- Blohm, M., & Koch, A. (2021). Monetary Incentives in Large-Scale Face-to-Face Surveys: Evidence from a Series of Experiments. International Journal of Public Opinion Research, 33(3), 690–702. https://doi.org/10.1093/ijpor/edab007
- Börsch-Supan, A., Krieger, U., & Schröder, M. (2013). Respondent incentives, interviewer training and survey participation. SHARE Working Paper Series, 12. https://share-eric.eu/fileadmin/user_upload/SHARE_Working_Paper/WP_Series_12_2013.pdf
- Budowski, M., & Scherpenzeel, A. (2005). Encouraging and maintaining participation in household surveys: the case of the Swiss household panel. ZUMA Nachrichten, 29(56), 10–36. https://nbn-resolving.org/urn:nbn:de:0168-ssoar-207568
- Campbell, R. M., Venn, T. J., & Anderson, N. M. (2018). Cost and performance tradeoffs between mail and internet survey modes in a nonmarket valuation study. Journal of Environmental Management, 210, 316–327. https://doi.org/10.1016/j.jenvman.2018.01.034
- Church, A. H. (1993). Estimating the Effect of Incentives on Mail Survey Response Rates: A Meta-Analysis. Public Opinion Quarterly, 57(1), 62. https://doi.org/10.1086/269355
- Cornesse, C., Felderer, B., Fikel, M., Krieger, U., & Blom, A. G. (2022). Recruiting a Probability-Based Online Panel via Postal Mail: Experimental Evidence. Social Science Computer Review, 40(5), 1259–1284. https://doi.org/10.1177/08944393211006059
- Czajka, J. L., & Beyler, A. (2016). Declining Response Rates in Federal Surveys: Trends and Implications.
- Daikeler, J., Bošnjak, M., & Lozar Manfreda, K. (2020). Web Versus Other Survey Modes: An Updated and Extended Meta-Analysis Comparing Response Rates. Journal of Survey Statistics and Methodology, 8(3), 513–539. https://doi.org/10.1093/jssam/smz008
- Dieleman, F. M. (2001). Modelling residential mobility; a review of recent trends in research. Journal of Housing and the Built Environment, 16(3/4), 249–265.
- Dillman, D. A [Don A.]. (1978). Mail and telephone surveys: The total design method. Wiley.
- Dillman, D. A [Don A.], Smyth, J. D., & Christian, L. M. (2014). Internet, phone, mail, and mixed-mode surveys: The tailored design method (4. ed.). Wiley.
- Eyerman, J., Bowman, K., Butler, D., & Wright, D. (2005). The differential impact of incentives on refusals: Results from the 2001 national household survey on drug abuse incentive experiment. Journal of Economic and Social Measurement, 30(2-3), 157–169. https://doi.org/10.3233/JEM-2005-0250
- Friedrichs, J., & Blasius, J. (2015). The Dwelling Panel – A New Research Method for Studying Urban Change. Raumforschung und Raumordnung, 73(6). https://doi.org/10.1007/s13147-015-0369-0
- Friedrichs, J., & Blasius, J. (2020). Neighborhood change – results from a dwelling panel. Housing Studies, 35(10), 1723–1741. https://doi.org/10.1080/02673037.2019.1699032
- Gallant, K. (2024, March 23). Warum das Robert Koch-Institut 180.000 Fünf-Euro-Scheine per Post verschickt. WirtschaftsWoche, 2024. https://www.wiwo.de/politik/deutschland/geld-per-post-warum-das-robert-koch-institut-180-000-fuenf-euro-scheine-per-post-verschickt-/29719806.html
- Göritz, A. (2006). Incentives in Web Studies: Methodological Issues and a Review. International Journal of Internet Science, 1(1), 58–70.
- Gouldner, A. W. (1960). The Norm of Reciprocity: A Preliminary Statement. American Sociological Review, 25(2), 161. https://doi.org/10.2307/2092623
- Groves, R. M [Robert M.], Singer, E., & Corning, A. D. (2000). Leverage-Saliency Theory of Survey Participation: Description and an Illustration. Public Opinion Quarterly, 64(3), 299–308.
- Haas, G.‑C., Volkert, M., & Senghaas, M. (2023). Effects of Prepaid Postage Stamps and Postcard Incentives in a Web Survey Experiment. Field Methods, 35(3), 253–270. https://doi.org/10.1177/1525822X221132401
- Holmberg, A., Lorenc, B., & Werner, P. (2010). Contact strategies to improve participation via the web in a mixed-mode mail and web survey. Journal of Official Statistics, 26(3), 465–480.
- Hsu, J. W., Schmeiser, M. D., Haggerty, C., & Nelson, S. (2017). The Effect of Large Monetary Incentives on Survey Completion. Public Opinion Quarterly, 81(3), 736–747. https://doi.org/10.1093/poq/nfx006
- Janssen, K. M. J., Cottineau, C., Kleinhans, R., & van Bueren, E. (2023). Gentrification and the Origin and Destination of Movers: A Systematic Review. Tijdschrift Voor Economische En Sociale Geografie, 114(4), 300–318. https://doi.org/10.1111/tesg.12581
- Kephart, W. M., & Bressler, M. (1958). Increasing the Responses to Mail Questionnaires: A Research Study. Public Opinion Quarterly, 22(2), 123. https://doi.org/10.1086/266773
- Lipps, O., Felder, M., Lauener, L., Meisser, A., Pekari, N., Rennwald, L., & Tresch, A. (2023). Targeting Incentives in Mature Probability-based Online Panels. https://surveyinsights.org/?p=18404 https://doi.org/10.13094/SMIF-2023-00010
- Lipps, O., Jaquet, J., Lauener, L., Tresch, A., & Pekari, N. (2022). Cost Efficiency of Incentives in Mature Probability-based Online Panels. Survey Methods: Insights from the Field. Advance online publication. https://doi.org/10.13094/SMIF-2022-00007
- Manfreda, K. L., Bosnjak, M., Berzelak, J., Haas, I., & Vehovar, V. (2008). Web Surveys versus other Survey Modes: A Meta-Analysis Comparing Response Rates. International Journal of Market Research, 50(1), 79–104. https://doi.org/10.1177/147078530805000107
- Meinfelder, L. (2024, November 15). Haben Sie auch schon Geld in der Post? Forscher verschenken 5-Euro-Scheine. Bild, 2024. https://www.bild.de/news/inland/haben-sie-auch-geld-in-der-post-forscher-verschenken-5-euro-scheine-673447b1d39c7b0c2a08b8c6
- Mercer, A., Caporaso, A., Cantor, D., & Townsend, R. (2015). How Much Gets You How Much? Monetary Incentives and Response Rates in Household Surveys. Public Opinion Quarterly, 79(1), 105–129. https://doi.org/10.1093/poq/nfu059
- Messer, B. L., & Dillman, D. A [Don A.] (2010). Using address-based sampling to survey the general public by mail vs. web plus mail. Social and Economic Sciences Research Center Technical Report.
- Millar, M. M., & Dillman, D. A. (2011). Improving Response to Web and Mixed-Mode Surveys. Public Opinion Quarterly, 75(2), 249–269. https://doi.org/10.1093/poq/nfr003
- Petrolia, D. R., & Bhattacharjee, S. (2009). Revisiting Incentive Effects. Public Opinion Quarterly, 73(3), 537–550. https://doi.org/10.1093/poq/nfp038
- Peytchev, A. (2013). Consequences of Survey Nonresponse. The ANNALS of the American Academy of Political and Social Science, 645(1), 88–111. https://doi.org/10.1177/0002716212461748
- Pforr, K., Blohm, M., Blom, A. G., Erdel, B., Felderer, B., Fräßdorf, M., Hajek, K., Helmschrott, S., Kleinert, C., Koch, A., Krieger, U., Kroh, M., Martin, S., Saßenroth, D., Schmiedeberg, C., Trüdinger, E.‑M., & Rammstedt, B. (2015). Are Incentive Effects on Response Rates and Nonresponse Bias in Large-scale, Face-to-face Surveys Generalizable to Germany? Evidence from Ten Experiments. Public Opinion Quarterly, 79(3), 740–768. https://doi.org/10.1093/poq/nfv014
- Porter, S. R., & Whitcomb, M. E. (2003). The Impact of Lottery Incentives on Student Survey Response Rates. Research in Higher Education, 44(4), 389–407. https://doi.org/10.1023/A:1024263031800
- Ryu, E., Couper, M. P [Mick P.], & Marans, R. W. (2006). Survey Incentives: Cash vs. In-Kind; Face-to-Face vs. Mail; Response Rate vs. Nonresponse Error. International Journal of Public Opinion Research, 18(1), 89–106. https://doi.org/10.1093/ijpor/edh089
- Saunders, J., Jobber, D., & Mitchell, V. (2006). The optimum prepaid monetary incentives for mail surveys. Journal of the Operational Research Society, 57(10), 1224–1230. https://doi.org/10.1057/palgrave.jors.2602053
- Schröder, M., Saßenroth, D., Körtner, J., Kroh, M., & Schupp (2013). Experimental evidence of the effect of monetary incentives on cross-sectional and longitudinal response: Experiences from the Socio-Economic Panel (SOEP). SOEPpapers on Multidisciplinary Panel Data Research, 603.
- Seil, M. K., Yu, P. M. S., Brackbill, P. M. R., & Turner, M. L. (2021). Web and paper survey mode patterns and preferences, Health & Employment Survey, World Trade Center Health Registry. Survey Practice, 14(1), 1–12. https://doi.org/10.29115/SP-2021-0006
- Shuttleworth, F. K. (1931). A study of questionnaire technique. Journal of Educational Psychology, 22(9), 652–658. https://doi.org/10.1037/h0074591
- Singer, E., Groves, R. M [Robert M.], & Corning, A. D. (1999). Differential incentives: Beliefs about practices, perceptions of equity, and effects on survey participation. Public Opinion Quarterly, 63(2), 251–260.
- Singer, E., van Hoewyk, J., Gebler, N., Raghunathan, T., & McGonagle, K. (1999). The Effect of Incentives on Response Rates in Interviewer-Mediated Survey. Journal of Official Statistics, 5(25), 217–230.
- Singer, E., & Ye, C. (2013). The Use and Effects of Incentives in Surveys. The ANNALS of the American Academy of Political and Social Science, 645(1), 112–141. https://doi.org/10.1177/0002716212458082
- Smith, M. G., Witte, M., Rocha, S., & Basner, M. (2019). Effectiveness of incentives and follow-up on increasing survey response rates and participation in field studies. BMC Medical Research Methodology, 19(1), 230. https://doi.org/10.1186/s12874-019-0868-8
- Stadt Köln (2021). Einpendeln und Auspendeln in Köln. Über Muster beim Berufspendeln 2019. Kölner Statistische Nachrichten, 2021(2). https://www.stadt-koeln.de/mediaasset/content/pdf15/statistik-wirtschaft-und-arbeitsmarkt/einpendeln_und_auspendeln_in_k%C3%B6ln_%E2%80%93_%C3%9Cber_muster_beim_berufspendeln_2019.pdf
- Stadtmüller, S., Beuthner, C., Christmann, P., Gummer, T., Kluge, R., Sand, M., & Silber, H. (2023). The interplay of incentives and mode-choice design in self-administered mixed-mode surveys. Bulletin of Sociological Methodology/Bulletin De Méthodologie Sociologique, 159(1), 49–74. https://doi.org/10.1177/07591063231184243
- The American Association for Public Opinion Research (AAPOR). (2023). Standard Definitions: Final Dispositions of Case Codes and Outcome Rates for Surveys. 10th edition. AAPOR.
- Warriner, K., Goyder, J., Gjertsen, H., Hohner, P., & McSpurren, K. (1996). Charities, No; Lotteries, No; Cash, Yes: Main Effects and Interactions in a Canadian Incentives Experiment. Public Opinion Quarterly, 60(4), 542. https://doi.org/10.1086/297772
- Wetzels, W., Schmeets, H., v. d. Brakel, J., & Feskens, R. (2008). Impact of Prepaid Incentives in Face-to-Face Surveys: A Large-Scale Experiment with Postage Stamps. International Journal of Public Opinion Research, 20(4), 507–516. https://doi.org/10.1093/ijpor/edn050
- White, E., Carney, P. A., & Kolar, A. S. (2005). Increasing response to mailed questionnaires by including a pencil/pen. American Journal of Epidemiology, 162(3), 261–266. https://doi.org/10.1093/aje/kwi194
- Wolf, C., Christmann, P., Gummer, T., Schnaudt, C., & Verhoeven, S. (2021). Conducting General Social Surveys as Self-Administered Mixed-Mode Surveys. Public Opinion Quarterly, 85(2), 623–648. https://doi.org/10.1093/poq/nfab039
- Zagorsky, J. L., & Rhoton, P. (2008). The Effects of Promised Monetary Incentives on Attrition in a Long-Term Panel Survey. Public Opinion Quarterly, 72(3), 502–513. https://doi.org/10.1093/poq/nfn025
-
Keywords
calibration CATI coverage coverage bias cross-national surveys data linkage data quality European Social Survey experiment face-to-face face-to-face survey Facebook hard to reach populations incentives item nonresponse measurement measurement error mixed-mode surveys multitasking non-probability samples Nonresponse nonresponse bias nonresponse rates paradata PIAAC Probability sample probability samples QR codes rare populations response rate Satisficing social desirability Social media survey survey-taking climate survey data survey management survey methods Telephone survey telephone surveys total survey error unit nonresponse validity web survey Web surveys weighting
