

Does matching interviewer and respondent gender improve data quality and reduce social desirability bias? Evidence from a mobile phone survey in India
Payal Hathi  University of California, Berkeley, USA
Diane Coffey University of Texas at Austin, USA
Amit Thorat Jawaharlal Nehru University, India
Amanda Nagle University of Texas at Austin, USA
Hathi P., Coffey D.,Thorat A. & Nagle A. Does matching interviewer and respondent gender improve data quality and reduce social desirability bias? Evidence from a mobile phone survey in India. Survey Methods: Insights From the Field. Retrieved from https://surveyinsights.org/?p=20157
© the authors 2025. This work is licensed under a Creative Commons Attribution 4.0 International License (CC BY 4.0) 
Abstract
Gender matching between interviewers and respondents has been used to improve survey quality. Research on interviewer gender effects from the United States and Europe finds that men respondents are sometimes more likely to report conservative attitudes to men interviewers than women interviewers. This study from a phone survey in India does not find that men report significantly different social attitudes to men and women interviewers. This suggests that in places where conservative and patriarchal social attitudes are widespread and accepted, common phenomena such as social desirability and gender performance may operate differently than in western contexts. We additionally find that men and women interviewers perform similarly in terms of rates of refusal, missing data, and ability to recruit samples with similar age and education distributions. However, women interviewers achieve higher response rates and are better able to reach some minority populations than men. Due to limitations such as small interviewer sample size, a lack of data on interviewer characteristics other than their gender, and the inclusion of only men respondents, more work is needed to understand whether higher response rates among women interviewers are due to greater skill, or to respondents’ preference to be interviewed by women rather than men. Given a lack of clear benefits to gender matching, survey administrators would be justified in hiring all-women survey teams in gender-conservative settings.
Keywords
gender attitudes, india, interviewer gender, social desirability, survey methods
Acknowledgement
We thank Nidhi Khurana for her dedication and hard work managing data collection, and Nikhil Srivastav for supporting the survey. We appreciate the time and efforts of the interviewers. Data collection was supported by a grant # OPP1125318 to r.i.c.e. Research was supported by a National Institute of Child Health and Human Development Training grant at the University of California, Berkeley [T32HD007275], and a grant awarded to the Population Research Center at The University of Texas at Austin by the Eunice Kennedy Shriver National Institute of Child Health and Human Development [P2CHD042849]. The content is solely the responsibility of the authors and does not necessarily represent the official views of the National Institutes of Health. Diane Coffey is supported by a Mentored Research Scientist Career Development Award K01HD103999 from the NICHD.
Copyright
© the authors 2025. This work is licensed under a Creative Commons Attribution 4.0 International License (CC BY 4.0)
Introduction
The survey methods that produce high quality data in one setting may not have the same consequences in others. In societies with conservative gender norms, survey administrators often match the gender of interviewers and respondents in order to influence survey participation and the quality of responses (Hersh et al 2021). In the United States and Europe, where it is not the default to match interviewer and respondent gender, gender matching has been investigated as an experimental tool to improve participation rates and question-level responses rates, and to reduce social desirability bias (Bittmann 2022; Catania et al 1996; Lipps 2010; West et al 2020).
This paper adds to that literature an investigation of not gender matching interviewers and respondents in Rajasthan, India where, due to patriarchal gender norms, it would otherwise be the default. Men respondents were randomly assigned to either a man interviewer or a woman interviewer. In Rajasthan, it would be considered socially unacceptable for men interviewers to ask women respondents for an interview, so we did not test this combination.
We undertook this study because, although it is more difficult to recruit women than men as interviewers in this context, we found that it was easier to retain women than men, so training costs would be lower with an all-women team. Due to the novelty of a woman interviewer requesting an interview with a man in this context, we also expected that women interviewers would produce higher response rates, thereby reducing follow-up costs.
The primary contribution of this study is to assess the benefits of matching women interviewers to men respondents (or the disadvantages of not doing so) in Rajasthan so that they can be considered by other survey administrators designing surveys in similar contexts. It also provides a new way to study the data quality produced by women interviewers as compared to men interviewers in a context where responses collected by men and women would otherwise not be comparable because the gender of the respondents would be different. To our knowledge, this is the first to study gender matching in a phone survey in India.
Background
Literature Review
Interviewer matching based on gender has been studied most extensively in the United States and Europe, with inconsistent results. West et al. (2020) find that women interviewers in a phone survey in Germany have higher participation rates from both men and women respondents, while Bittmann (2022) finds that, in face-to-face surveys across European countries, matching interviewers and respondents by gender increases item non-response for women but decreases it for men. In phone surveys in the United States, Kane & McCauly (1993) and Huddy et al. (1997) find that men respondents report more egalitarian gender attitudes to women interviewers than to men interviewers. The authors posit that men respondents may try to be more polite to women interviewers than to men interviewers and may try to give responses that conform to more egalitarian gender norms in their interactions with women. In contrast, Catania et al (1996) find that in phone surveys in the United States, question content interacts with the gender of the interviewer. Respondents are more likely to feel comfortable answering sensitive questions to gender-matched interviewers for some questions but not all.
Interviewer gender effects have also been studied, though less extensively, in places with stronger patriarchal norms. For instance, in a face-to-face survey in Morocco, Benstead (2014) finds that men respondents report more egalitarian views to women interviewers than to men interviewers. They also find that men interviewers are less likely to record non-response. The authors posit that the former is likely a manifestation of social desirability bias and the latter may be due to power differences between men and women. Flores-Macias & Lawson (2008) explore interviewer gender effects on questions about public policy in a phone survey in Mexico. They find no effect of interviewer gender on item non-response, but find that men respondents in Mexico City reported more egalitarian attitudes on gender-sensitive questions to women interviewers than to men interviewers. The authors raise the possibility that these effects might arise if women interviewers remind respondents of egalitarian views they already hold. However, they do not rule out differential social desirability bias as an explanation.
Study context
Rajasthan, a state in western India, is arguably a more patriarchal context than the settings of the studies described above: the 2011 Census of India found that there were only 888 girl children aged zero to six for every 1000 boys, resulting from son preference that leads to sex-selective abortion (Hesketh & Xing 2006, Jha et al 2006) and higher mortality among girl children than boy children (Dutta et al 2022, Pennington et al 2003, Sekher & Hatti 2005). India’s 2015 Demographic and Health Survey, called the National Family Health Survey, found that only 57% of adult women in Rajasthan are literate, compared with 85% of men; and that only 29% of women were employed in the year before the survey, compared to 75% of men (IIPS & ICF 2017). In 2022, the National Crime Records Bureau data ranked Rajasthan 4th highest out of 28 Indian states for First Information Reports filed in crimes against women cases. Although social scientists urge caution in interpreting these data (Rukmini 2022), in part because they do not capture the full extent of crimes against women (Sharma & Gupta 2024), this is nevertheless consistent with other indicators about gender in Rajasthan.
Although Rajasthan is a highly patriarchal society, people are also aware of government, civil society, and international efforts to improve women’s status and promote equality. For example, in the 1990s, the central government of India implemented high-profile affirmative action policies that reserve seats in political office for women. Many development programs focus on women’s empowerment. Studying interviewer effects in this context may shed new light on the effects of gender matching on data collection efficiency and quality and the workings of social desirability bias.
Experiment and research questions
The experiment analyzed here takes place within the Social Attitudes Research India (SARI) survey, a mobile phone survey that assessed social attitudes and discriminatory behaviors of adults in 2016-17. We randomly assigned men and women interviewers to interview men in a subsample of the larger survey which otherwise matched interviewer and respondent gender. We investigate whether, when interviewing men, women and men interviewers produce different overall response rates, response rates for socially marginalized populations, refusal rates, item nonresponse rates, and sample representativeness. We also investigate whether men give different answers to men and women interviewers on questions related to the status of women.
We hypothesize that, as in previous studies, social desirability norms would result in male respondents reporting more egalitarian attitudes to female interviewers compared to male interviewers. Additionally, we expect that female interviewers will perform better on data collection measures like response and refusal rates compared to male interviewers because of the novelty that sampled men would feel in speaking to a woman on the phone in this context. On other performance metrics, we expect female interviewers to perform worse than male interviewers because of their lack of experience: historically, in this context, women have not had access to employment and generally have less professional and education experience.
Data, measures, and analysis
The Social Attitudes Research, India (SARI) survey
Social Attitudes Research, India (SARI) is a mobile phone survey designed to collect data from adults who live in India and who are between the ages of 18 and 65. Data have been collected in Delhi, Uttar Pradesh, Rajasthan, Mumbai, Maharashtra, Bihar, and Jharkhand. Except for the men who were interviewed by women in the Rajasthan survey, respondents in each of these samples were interviewed by a person of the same gender.
SARI uses random digit dialing to recruit a random sample of households with at least one mobile phone owner. In each place-specific mobile circle in India, the Department of Telecommunications issues a certain number of 5-digit “series” to each phone company to use as the first 5 digits of the phone numbers they sell to consumers. SARI generates potentially active phone numbers by concatenating the five-digit series (listed in proportion to the number of subscribers to that phone company) with five randomly generated digits to form 10-digit mobile phone numbers. Approximately 50% of phone numbers generated in this way are active, as opposed to not in use, switched off, or out-of-range. Interviewers call these numbers in a random order.
The data analyzed here were collected between August 2016 and May 2017 by eight interviewers. They interviewed 2,738 men in Rajasthan, out of whom 1,143 were interviewed by men and 1,595 were interviewed by women. In Rajasthan, most respondents took the survey in Hindi, however, some respondents took the survey in Marwari or Bagdi. Marwari and Bagdi surveys were administered by the subset of interviewers who are native speakers.
Since individuals from some demographic groups are more likely to respond to the survey than others, we weight our results using statistical weights created from the population data for the state of Rajasthan provided in the 2011 India Census. Weights account for the intersection of sex, place (urban/rural), education, and age. For a more complete description of SARI’s methodology see Hathi et al (2020).
We present the results about social attitudes using non-response weights because we are evaluating response bias and want to account for respondent composition differences. Our analyses of survey process measures and sample demographic composition do not use non-response weights because we are evaluating the differences in the respondent pool that interviewers are able to achieve. We note that results about social attitudes that do not use weights are very similar.
Analyses were conducted using Stata, version 15.0 and R 4.4.1.
Experimental Condition
Phone numbers were randomly assigned to men or women interviewers. Women interviewers alternated the weeks in which they were assigned to interview men and women. Since this was a random digit dial survey, interviewing a man or a woman was achieved by conducting a within-household random selection of a particular respondent by gender. At the beginning of the call, the interviewer asks the person who answers the phone to list all of the men or women in the household, depending on the sex of the respondent who he/she is supposed to interview. Survey respondents are selected randomly from the household listing by Qualtrics software. Within-household respondent selection ensures that even individuals who do not own their own mobile phones have a chance to be interviewed.
Data quality measures
We compare the following measures of data quality for the respondents interviewed by women and the respondents interviewed by men:
Response rate. We calculate the response rate following AAPOR Response Rate 2 (AAPOR, 2023). This is the number of surveys in which the respondent answers at least a third of the questions, divided by the number of mobile numbers that are valid when the interviewer first calls them. The interviewer level response rates are compared using t-tests with Welch’s approximation for differences in means. The sample size for these tests is eight as interviewers are the unit of analysis. As robustness tests, we also use permutation tests to compare mean rates between men and women interviewers. Permutation tests do not make assumptions about the distributions of response rates (i.e. normality).
Refusal rate. Cases when the person who answers the phone declines to participate on behalf of the household, or when a respondent is selected from among appropriate-gender household members, but that person refuses to participate, are in the numerator of the refusal rate. The denominator is the number of phone numbers that are valid on the first call attempt. Interviewer-level refusal rates are compared using t-tests for differences in means with Welch’s approximation. The sample size for these tests is eight because the interviewer is the unit of analysis. We again use permutation tests to compare the mean rates between the men and women interviewers.
We note that the refusal rate does not equal one minus the response rate for two reasons. First, some interviews are completed after “refusal conversion.” Refusal conversion is when, about a month after someone refuses household member listing, a different interviewer (of the same gender as the first interviewer) calls back to explain the survey to whomever answers the phone and to try again to complete household member listing and select a respondent of the originally assigned gender. These interviews are included in the numerators of both the response rate and the refusal rate. Second, an interview would be counted in the numerators of both the response rate and the refusal rate if the respondent completed more than one third of the survey and then refused.
Item nonresponse rate. For each respondent, we count the total number of missing responses across the nine questions that had the most overall item nonresponse in the survey[1]. We assess differences in total item nonresponse across these questions by interviewer gender. Interviewers are trained to ask a question twice if a respondent does not initially understand, and to create an environment in which respondents feel comfortable answering frankly.
To test for differences in item nonresponse by interviewer gender, we conduct a multilevel poisson regression on the count of nonresponse across nine questions, with interviewer gender as a second level predictor variable, to assess whether men and women interviewers differ in the volume of nonresponse.
As a robustness check, we run a series of multilevel logistic regressions with a binary outcome of nonresponse for each individual question. We include interviewer gender as a second level predictor variable to account for respondents being clustered within interviewers.
Age heaping rate. Age heaping occurs when respondents report their ages as a round number ending in a “5” or “0.” It is a common problem in surveys in low- and middle-income countries where people do not always know their dates of birth. Interviewers with lower rates of heaping probe respondents in ways that help them record exact ages, rather than accepting approximations. While some respondents do in fact have an age that is a round number, a statistically significant difference in the percent of round ages collected by men and women interviewers demonstrates a difference in data quality. We conduct a t-test with Welch’s approximation to compare the percent of age-heaped responses between men and women interviewers. As a robustness check, we conduct multilevel logistic regression using age heaping as the outcome variable and the gender of the interviewer as a level two predictor to account for respondents being clustered within interviewers.
Representativeness – age and education distributions. We compare the distribution of age and education among respondents in the SARI samples recruited by men and women interviewers to the Census 2011 data for the state of Rajasthan. This allows us to assess whether men and women interviewers recruit participants with different ages or education levels, on average. This is useful to know because, across Indian states, older respondents and less educated respondents have been more difficult for SARI interviewers to recruit. To test for differences in sample representativeness in the respondent samples gathered by men and women interviewers, we use Kolmogorov-Smirnov tests for the equality of distributions.
Representativeness – marginalized groups. Across the places that the SARI survey was conducted, Dalit and Muslim participants tended to be more difficult to recruit than higher-caste and Hindu participants. Dalits belong to the most oppressed castes in Indian society and have traditionally been expected to perform the most menial and degrading work, such as cleaning feces and garbage. They have faced widespread discrimination based on their association with these jobs (Desai et al 2010, NCRB 2022, Thorat & Neuman 2012, Thorat & Joshi 2020). Muslims are a religious minority in India who often face discrimination and, sometimes, violence (Maizland 2024). Because of their marginalized group identities, we believe that Muslims and Dalits may be more suspicious of the interviewers and the purpose of the study.
SARI asked respondents about caste group and religious affiliation in separate questions. Interviewers who make sample members feel comfortable and safe answering the survey are better able to recruit respondents from these marginalized groups. Gathering more responses from Dalit and Muslim sample members also increases precision around estimates improves sample representativeness.
We calculate the percent of respondents that are Dalit and Muslim for each interviewer. We conduct t-tests with Welch’s approximation and permutation tests to compare the average percent of Dalit and Muslim respondents between men and women interviewers.
Socially Desirable Responses
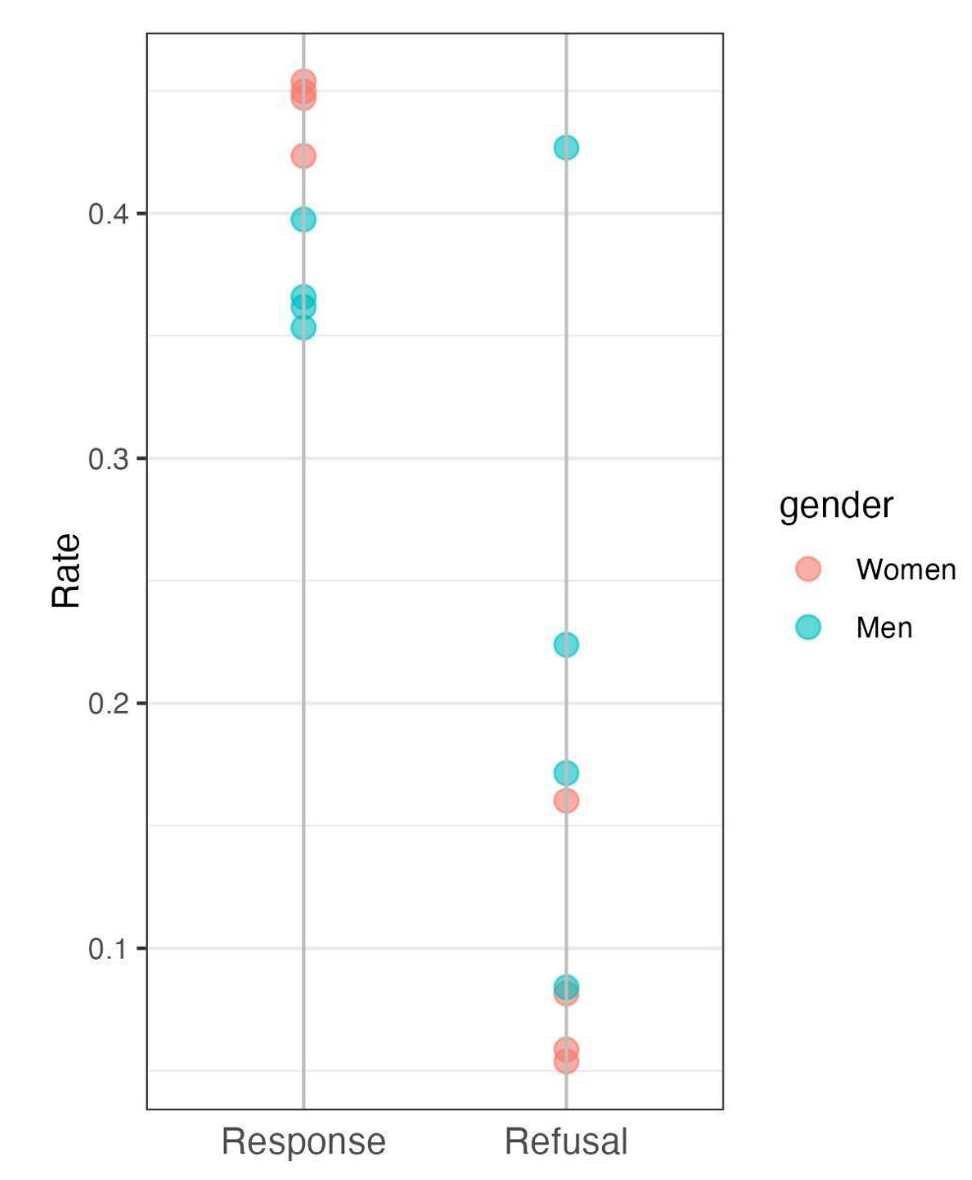
We also investigated whether women interviewers collected more socially desirable (less gender conservative) responses from men respondents than men interviewers. Table 1 details the social attitudes questions that were asked to men respondents; conservative responses are bolded.
To provide context on the cultural practices that the second question references: “Ghunghat or pallu” is when a woman places the end of her sari over her head or head and face in order to show deference and modesty in front of men. “Pardah” is when a woman rarely leaves the house and covers herself when she does leave. Practicing “burkha” is when a woman wears a loose-fitting dark cloth over her head and body, or head, face, and body when outside the home. Following the India Human Development Survey (Desai, Vanneman, & NCAER 2005 & 2012), we ask Hindu respondents about “ghunghat or pallu” and Muslim respondents about “pardah or burkha.”
We test for differences in conservative responses on gender equality items reported to men and women interviewers. First, we calculate the proportion of conservative responses to each gender item for each interviewer. Then we use t-tests with Welch’s approximation to compare the mean conservative proportion for women interviewers and men interviewers. As a robustness check, we conduct multilevel logistic regression using a binary response to questions on gender equality (conservative response or not conservative response) as the outcome variable and the gender of the interviewer as a level two predictor to account for respondents being clustered within interviewers.
Table 1. Social attitudes questions, response options, and sample sizes
Notes: a Conservative responses are highlighted in bold. b This question is only asked to married respondents. Hindus were asked about practicing “ghughat or pallu” and Muslims were asked about practicing “pardah or burkha.”
Limitations of the analysis
We note three main limitations of this analysis. First, our study includes a small sample size of eight interviewers. In assessing differences in survey outcomes between men and women interviewers using statistical tests, the small number of interviewers complicates statistical inference. Although this should be considered when assessing results, we provide additional analyses as robustness checks to verify our findings.
Second, we do not have detailed personal information about each interviewer, such as their age or level of education. Knowing these details would allow us to assess with greater certainty whether differences in interviewer outcomes were due to the gender of the interviewer, other salient personal characteristics, or interviewer skill. Accessing this employee data as researchers is not common but could be implemented in future studies.
Third, this experiment included only men respondents. Ideally, to fully understand interviewer effects, we would have been able to compare interviewer outcomes with women respondents also. However, it was not culturally appropriate to ask women to respond to questions posed by a man interviewer.
Results
Data quality outcomes
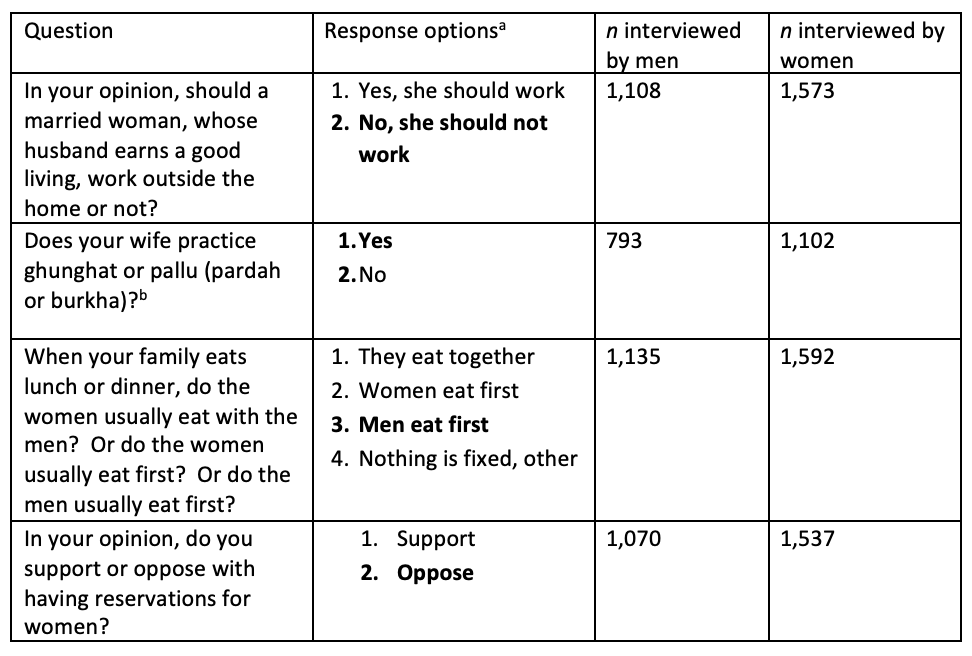
Response and refusal rates. Figure 1 shows unweighted response rates on the left and refusal rates on the right for men and women interviewers. Each point represents an individual interviewer, with women interviewers in pink and men interviewers in blue.
Figure 1. Response rates (left) and refusal rates (right) for four women interviewers interviewing men compared with four men interviewers interviewing men
Response rates are statistically significantly higher for women interviewers interviewing men than for men interviewers interviewing men (44.4% vs. 37.0%, n=8, ; difference in response rate: 7.4 percentage points, 95% CI: (4.4pp, 10.4pp); Welch’s t-test p<0.05, permutation test p<0.05). Refusal rates are lower for women interviewers than men interviewers, but the difference is not statistically significant (8.9% vs. 22.7%, n=8; difference in refusal rate: -13.8 percentage points, 95% CI (-35.9pp, 8.3pp), Welch’s t-test p=0.15, permutation test p=0.05). To put these response and refusal rates in context, a study of the Pew Research Center’s 2012 phone surveys in the US found an average response rate of 9% (Kohut et al., 2012). Thus, response rates for SARI are quite high. Although most recent assessments of phone survey participation no longer report refusal rates, we note that Groves & Fultz’s 1985 research on economic attitudes found refusal rates from a landline phone survey of 22% for men interviewers and 17% for women interviewers.
Item nonresponse. The proportion of item nonresponse for the nine sensitive questions with the most overall item nonresponse in the survey ranged from 2.1% to 6.1%. Results from a multilevel poisson regression assessing whether men and women interviewers differ in how many nonresponses they get across these nine questions show that although men interviewers have more item nonresponse than women interviewers, there is no statistically significant difference (incidence rate ratio = 1.9, 95% CI: (0.7, 5.0), p=0.20. Multilevel logistic regression results for individual questions show that with the exception of the question of whether a man’s spouse practiced ghungat/pallu or pardah/burkha (OR = 2.1, 95% CI: (1.0, 4.2), p<0.05), having been interviewed by a man rather than a woman does not predict item non-response.
Age heaping rate. In analysis of the unweighted age data, we find that men interviewers received an average of 38.3% age-heaped responses, while women interviewers received an average of 39.2% age heaped responses. The difference between these rates is not statistically significant (difference in percent of age heaped responses: 0.9 percentage points, n=8; 95% CI (-11.5pp, 12.9 pp), Welch’s t-test p=0.84). Results from a multilevel logistic model of age heaping on interviewer gender confirm that there is no statistically significant difference in age heaping (OR = 0.9, 95% CI (0.7, 1.3), p=0.59).
Representativeness – age and education distributions. Next, we compare the demographics of men respondents recruited by women interviewers to those recruited by men interviewers, starting with age and education. Using unweighted cumulative distribution functions, the two panels in Figure 2 compare whether the age (top) and education (bottom) samples collected by men and women interviewers are coming from different distributions. The distributions are quite closely overlapping across all ages, suggesting that the two samples do in fact come from the same age distribution. Similarly, there is close overlap between the samples in the education distribution. For both age and education distributions, we also perform Kolmogorov-Smirnov tests to check the equality of the two distributions. We find no evidence that the cumulative distribution functions of age and education differ by the gender of the interviewer: the KS test does not result in rejecting the null hypothesis that the two samples of age (n=8, p=0.52) and educational attainments (n=8, p=1.00) come from the same distribution.
Figure 2. Cumulative Distribution Functions for age (top) and education (bottom)
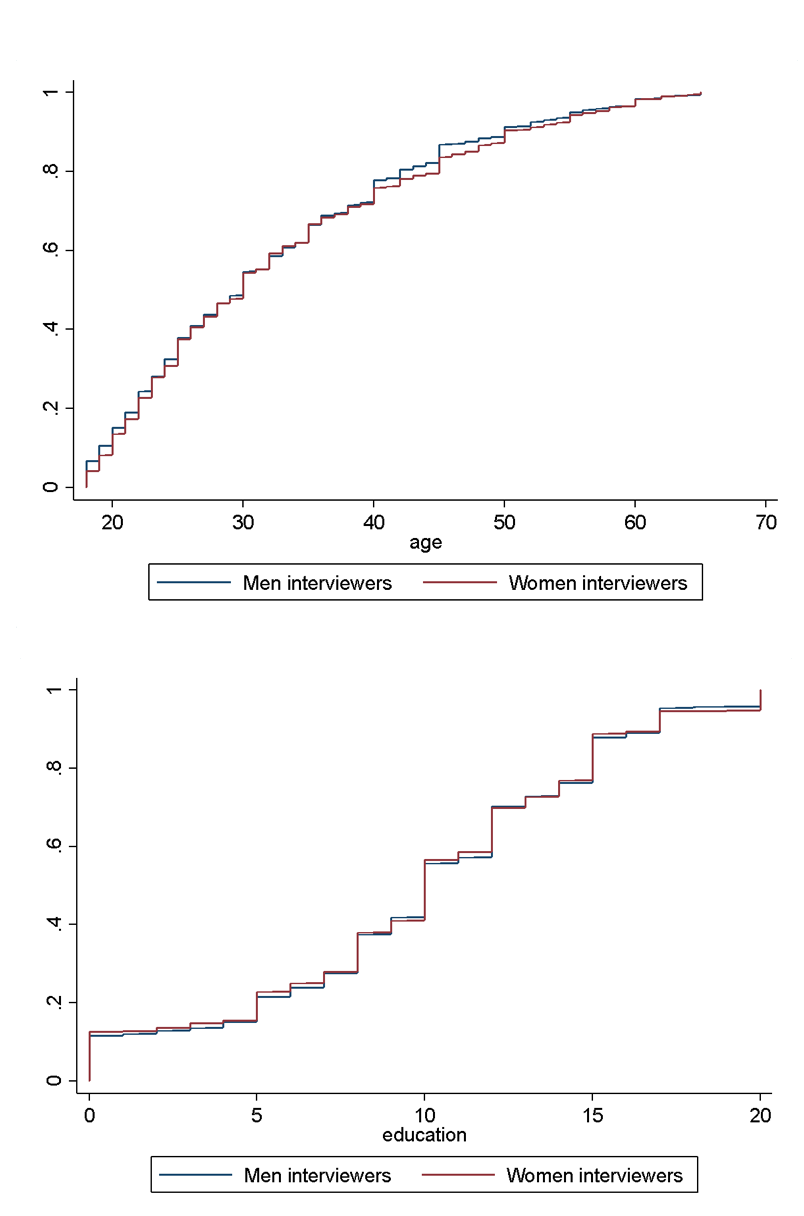
Note: We use a Kolmogorov-Smirnov test to test the equality of the two distributions for age and for education. For both variables, the KS test does not allow us to reject the null hypothesis that the two samples of ages come from the same distribution.
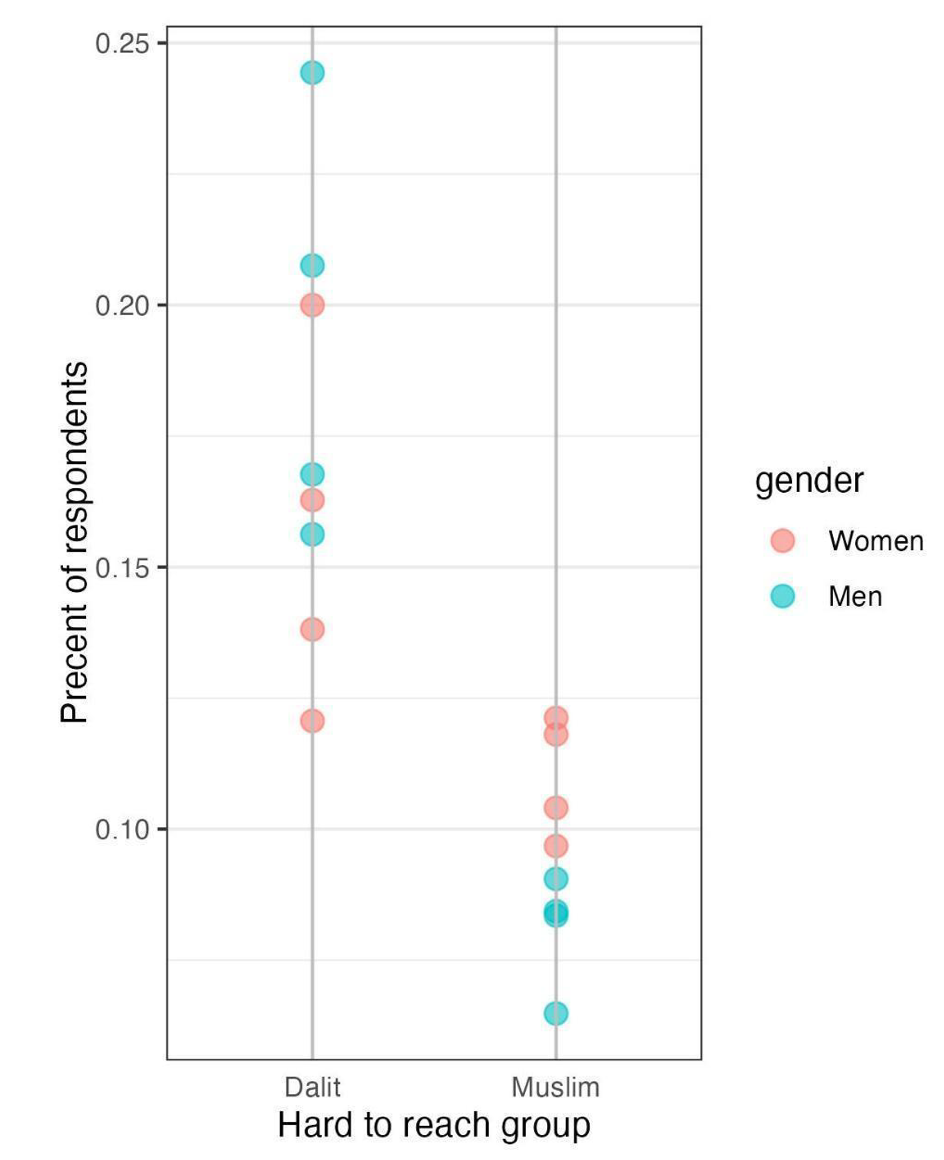
Representativeness – hard-to-reach groups. Figure 3 shows that, on average, women interviewers conducted a higher proportion of their interviews with Muslim men than men interviewers did (11.0% vs. 8.1%, n=8; difference in reaching Muslim respondents: 2.9 percentage points, 95% CI:(1.0pp, 4.9pp); Welch’s t-test p<0.05, permutation test p<0.05). Women conducted an average of 15.5% interviews with Dalit men, compared to an average of 19.5% for men interviewers, but this difference is not statistically significant (n=8; difference in reaching Dalit respondents: -4.0 percentage points 95% CI:(-10.4pp, 2.6pp), Welch’s t-test p=0.20, permutation test p=0.17).
Figure 3. Fraction of respondents that were Dalit and Muslim: four men versus four women interviewers
Response Quality Outcomes
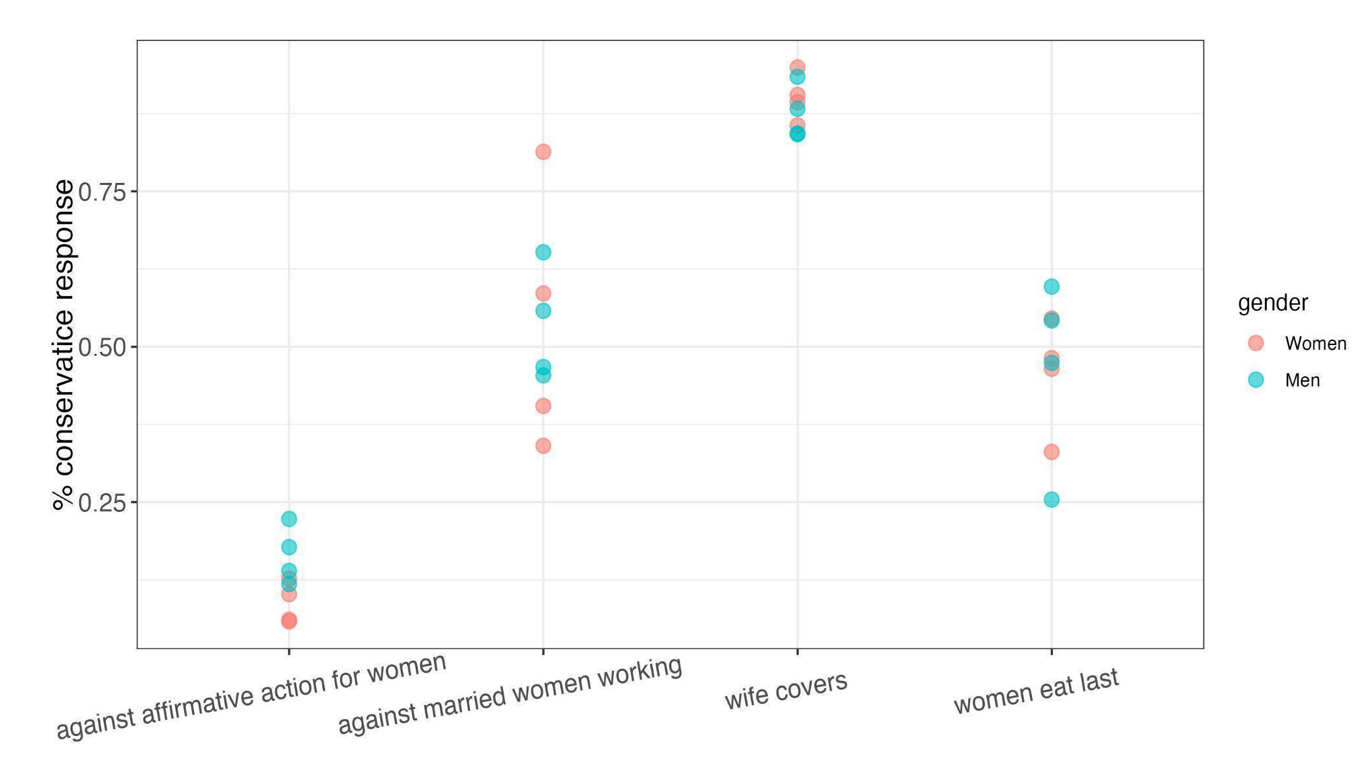
Outcomes related to social desirability. Figure 4 shows the proportions of conservative responses to men versus women interviewers on questions related to the status of women. Reported attitudes are similar across the two groups: with the exception of support for affirmative action for women, men and women interviewers did not get significantly different responses. For example, 45.6% of respondents told men interviewers that the women in their household eat last, compared to 46.7% of respondents who were asked the same question by women interviewers. For the item on support for affirmative action, men interviewers received conservative responses to the question 16.5% of the time and woman interviewers received conservative responses 8.7% percent of the time (n=8; difference in conservative response to support for affirmative action: -7.8 percentage points, 95% CI: (-14.9pp, -0.6pp), Welch’s t-test p<0.05). Results from multilevel logistic regressions of each attitude on interviewer gender confirm that men and women interviewers only get statistically significantly different responses for reported attitudes about support for affirmative action for women. For that regression, the odds ratio on being reporting a conservative response when being interviewed by a man was 1.8 (95% CI: (1.3, 2.5), p<0.05).
Figure 4. The interviewer-level proportion of men who report conservative gender attitudes on four questions
Discussion
The goal of this study is to understand the consequences of not gender matching interviewers to respondents in a patriarchal context in which interviewer gender matching is the norm. Overall, we find that when interviewing men respondents, women interviewers have higher response rates than men interviewers, and are better able to reach some minority populations. On all other measures including rates of refusal, item non-response, accuracy of age and education distributions, and age heaping, we find no statistically significant differences between men and women interviewers. Additionally, we find similar reported attitudes by men respondents to both women and men interviewers on questions about the status of women.
Why might women interviewers have more success on some indicators of data collection quality, like higher response rates and achieving greater survey cooperation from minority populations? This may be due to the way men respondents react to women interviewers, or it may be due to higher skill among women interviewers. One limitation of this study is that we cannot separate these two possibilities definitively. However, in a context in which women interviewers are likely to have less survey-relevant work experience compared to their men counterparts, and where there are limited men-women interactions outside of one’s own family, the more likely explanation may be that men may be more interested in talking to a woman on the phone than in talking to a man.
In contrast to some prior research which found that men tend to report more egalitarian and less conservative attitudes to women interviewers, we found that to be true for only one of the four questions we analyzed. Further, the difference was small. We posit that this context, where gender discrimination is severe and conservative social attitudes towards women are highly prevalent, it may not be seen as socially desirable to report egalitarian attitudes and behaviors, and therefore men do not change their answers to conform to what may be more palatable for women interviewers to hear. Johnson & van de Vijver (2003) suggest that social desirability is most important for issues that are contested within a given context. If women’s lower social status is relatively uncontested, men may not be conscious of their privilege and women’s relative lack of privilege, negating the need to change one’s reported beliefs based on the position or characteristics of the interviewer. Men may report their attitudes without worrying about political correctness in a society where women’s lower status is generally accepted.
We conclude that there were no appreciable benefits of gender matching in this context, and that future survey rounds would be justified in hiring all-women survey teams. Women interviewers are a must for interviewing women and are able to achieve as high or higher quality results with men respondents as men interviewers. Other survey administrators may find these results useful when fielding surveys in gender-conservative settings.
Endnote
[1] These questions are: (1) In your opinion, is your family poor, labor class, middle-class or comfortable? (2) In your opinion, should there be a law stopping high caste and low caste people from marrying each other? (3) In your opinion, do you support or oppose with having reservations based on caste? (4) In your opinion, do you support or oppose with having reservations for women? (5) In your opinion, should a young girl or boy select a spouse/life partner for him/herself or should his/her parents select a spouse/life partner for him/her? (6) If a close relative or someone in your family married someone from a Harijan or Dalit caste would you oppose it or not? (7) Does your wife wear ghunghat or pallu / pardah or burkha? (8) Does anyone in your family believe in/practice untouchability? (9) In your opinion, should a married woman, whose husband earns well, work outside the home or not?
References
- The American Association for Public Opinion Research. 2023 Standard Definitions: Final Dispositions of Case Codes and Outcome Rates for Surveys. 10th edition. AAPOR.
- Benstead, L. J. (2014). Effects of interviewer–respondent gender interaction on attitudes toward women and politics: Findings from Morocco. International Journal of Public Opinion Research, 26(3), 369-383.
- Bittmann, F. (2022). Improving Data Quality with Sociodemographic Matching?: About the Effects and Implications of Age and Gender Matching in Face-to-Face Interviews. Journal of Applied Social Science, 16(1), 242-260.
- Catania, J. A., Binson, D., Canchola, J., Pollack, L. M., Hauck, W., & Coates, T. J. (1996). Effects of interviewer gender, interviewer choice, and item wording on responses to questions concerning sexual behavior. Public Opinion Quarterly, 60(3), 345-375.
- Desai, S. B., Dubey, A., Joshi, B. L., Sen, M., Shariff, A., & Vanneman, R. (2010). Human development in India. New York: Oxford University.
- Desai, Sonalde, Reeve Vanneman, and National Council of Applied Economic Research, New Delhi. India Human Development Survey (IHDS), 2005 & 2012. ICPSR22626-v11. Ann Arbor, MI: Inter-university Consortium for Political and Social Research [distributor].
- Dutta, S., Mishra, S. K., & Mehta, A. K. (2022). Gender Discrimination in Infant and Young Child Feeding Practices in India: Evidence from NFHS-4. Indian Journal of Human Development, 16(2), 286-304.
- Elkasabi, M., & Khan, A. (2022). Modeling Interviewer Effects in DHS Surveys (MR32): An Analysis Brief from The DHS Program. Rockville, Maryland, USA: ICF.
- Flores-Macias, F., & Lawson, C. (2008). Effects of interviewer gender on survey responses: Findings from a household survey in Mexico. International journal of public opinion research, 20(1), 100-110.
- Government of India. 2011. Census of India 2011 – Population enumeration by caste and religion. Office of the Registrar General & Census Commissioner, India. Retrieved September 1, 2019. http://www.censusindia.gov.in/2011census/population_enumeration.html
- Groves, Robert M. & Nancy H. Fultz. 1985. “Gender effects among telephone interviewers in a survey of economic attitudes.” Sociological Methods & Research 14(1): 31-52.
- Hathi, P., Thorat, A., Khalid, N., Khurana, N., & Coffey, D. (2020). Mobile Phone Survey Methods for Measuring Social Discrimination. NCAER National Data Innovation Centre Institutional Research Grant Report Number 02. Retrieved June 30, 2020. https://www.ncaer.org/wp-content/uploads/2022/09/2.pdf.
- Hersh, S., Nair, D., Komaragiri, P. B., & Adlakha, R. K. (2021). Patchy signals: capturing women’s voices in mobile phone surveys of rural India. BMJ Global Health, 6(Suppl 5), e005411.
- Hesketh, T., & Xing, Z. W. (2006). Abnormal sex ratios in human populations: causes and consequences. Proceedings of the National Academy of Sciences, 103(36), 13271-13275.
- Huddy, L., Billig, J., Bracciodieta, J., Hoeffler, L., Moynihan, P. J., & Pugliani, P. (1997). The effect of interviewer gender on the survey response. Political Behavior, 19, 197-220.
- International Institute for Population Sciences (IIPS) and ICF. 2017. National Family Health Survey (NFHS-4), 2015-16: India. Mumbai: IIPS.
- Jha, P., Kumar, R., Vasa, P., Dhingra, N., Thiruchelvam, D., & Moineddin, R. (2006). Low male-to-female sex ratio of children born in India: national survey of 1· 1 million households. The Lancet, 367(9506), 211-218.
- Johnson, Timothy P. & Fons van de Vijver. 2003. “Social desirability in cross-cultural research.” In J. A. Harkness, F. J. R. van de Vijver, & P. P. Mohler (Eds.), Cross-Cultural Survey Methods (pp. 195-204). New York: Wiley.
- Kane, E. W., & Macaulay, L. J. (1993). Interviewer gender and gender attitudes. Public opinion quarterly, 57(1), 1-28.
- Kohut, Andrew, Scott Keeter, Carroll Doherty, Michael Dimock, and Leah Christian. 2012. “Assessing the representativeness of public opinion surveys.” Pew Research Center, Washington, DC.
- Lipps, O. (2010). Interviewer-Respondent Socio-Demographic Matching and Survey Cooperation. Survey Practice, 3(4).
- Maizland, L. (2024). India’s Muslims: An increasingly marginalized population. Council on Foreign Relations. https://www.cfr.org/backgrounder/india-muslims-marginalized-population-bjp-modi
- National Crime Records Bureau. (2022). Crime in India. Government of India Ministry of Home Affairs. Available online: https://www.ncrb.gov.in/crime-in-india-year-wise.html?year=2022&keyword=
- Pennington, A., Maudsley, G., & Whitehead, M. (2023). The impacts of profound gender discrimination on the survival of girls and women in son-preference countries-A systematic review. Health & Place, 79, 102942.
- Rukmini, S. (2022). Whole numbers and half truths: What data can and cannot tell us about modern India. Westland.
- Sekher, T. V., & Hatti, N. (2005). Discrimination of female children in modern India: from conception through childhood. In XXV International Population Conference, International Union for the Scientific Study of Population, Tours, France.
- Sharma, K. & Gupta, A. (2024). Violence against women in India: Levels and trends of incidence and reporting. Economic and Political Weekly. 59(35).
- Thorat, A., & Joshi, O. (2020). The continuing practice of untouchability in India. Economic & Political Weekly, 55(2), 37.
- Thorat, S., & Neuman, K. S. (2012). Blocked by caste: Economic discrimination in modern India. Oxford University Press.
- West, B. T., Elliott, M. R., Mneimneh, Z., Wagner, J., Peytchev, A., & Trappmann, M. (2020). An examination of an interviewer-respondent matching protocol in a longitudinal CATI study. Journal of Survey Statistics and Methodology, 8(2), 304-324.
-
Keywords
calibration CATI coverage coverage bias cross-national surveys data linkage data quality European Social Survey experiment face-to-face face-to-face survey Facebook hard to reach populations incentives item nonresponse measurement measurement error mixed-mode surveys multitasking non-probability samples Nonresponse nonresponse bias nonresponse rates paradata PIAAC Probability sample probability samples QR codes rare populations response rate Satisficing social desirability Social media survey survey-taking climate survey data survey management survey methods Telephone survey telephone surveys total survey error unit nonresponse validity web survey Web surveys weighting
