

Who are the online panelists and why they cannot represent the general population
Stéphane Legleye  Université Paris-Saclay, Inserm, CESP; Centre de Recherche en Économie and Statistique (CREST), France
Guillaume Chauvet Ecole Nationale de la Statistique et de l’Analyse de l’Information (ENSAI), CNRS and Université de Rennes, France
Thomas Merly-Alpa - Institut national de la statistique et des études économiques (Insee), France
Noémie Soullier - Santé publique France, France
Legleye S., Chauvet G., Merly-Alpa T. & Soullier N. (2025). Who are the online panelists and why they cannot represent the general population. Survey Methods: Insights from the Field. Retrieved from https://surveyinsights.org/?p=20647
© the authors 2025. This work is licensed under a Creative Commons Attribution 4.0 International License (CC BY 4.0) 
Abstract
The vast majority of Internet surveys are conducted using "online" panels (known as access panels, online or opt-in panels). As non-probability samples, access panel surveys have been questioned based on general theoretical arguments and empirical studies. Although convincing, these theoretical arguments cannot rule out the possibility that a specific survey on a specific access panel may produce results that are very close to those of a competing, high-quality probability survey. On the other hand, empirical studies are conducted on a limited set of panels and do not inform on the very nature of panelists in general that explains the biases observed in most studies in particular. We use a large mixed-mode probability general population survey to describe the general population of panelists from which each access panel is a subsample. We found that it has specific online behaviors, compared to the other Internet users: panelists stand out for their more active and informed online behaviors, making greater use of social networks, posting more messages, expressing more often political opinions, claiming more often for their rights or social benefits. Multivariable and propensity score analyses showed that these specificities are independent of their sociodemographic characteristics. The population of panelists of online panels forms thus a sampling frame of Internet users that cannot represent the general population it is intended to represent. This explains why generalizations of results obtained from any access panel are likely to be biased.
Keywords
access panel, bias, probability and non-probability, survey methods, Web surveys
Copyright
© the authors 2025. This work is licensed under a Creative Commons Attribution 4.0 International License (CC BY 4.0)
1. Introduction
1.1 Background
Aided by the spread of Internet use among all segments of the population worldwide, access panels have become essential sources for commercial surveys, whether for conducting opinion polls, consumer surveys, market research or even sociological studies. Access panel surveys are based on non-probabilistic and often opaque recruitment. They serve as a reservoir for quickly drawing samples and conducting surveys. As surveys conducted on the Internet, surveys conducted in access panels present a series of methodological advantages over traditional surveys conducted by interviewers, whether face-to-face or by telephone. They allow a larger number of people to respond simultaneously and offer respondents the opportunity to participate at a time that suits them, reducing the duration of the data collection. Additionally, because they are self-administered, Internet surveys are particularly suitable for sensitive topics, reducing the social desirability bias associated with interviewers (De Leeuw 2008, Tourangeau and Yan 2007). In addition, the cost of Internet probability surveys is generally lower (Bianchi, Biffignandi, and Lynn 2017, Soullier et al. 2023, Narayan and McGonagle 2021). Surveys conducted in access panels are even cheaper than their probabilistic counterpart (Mauz et al. 2018), partly because the recruitment of panelists in access panels is made through an mix of online and offline procedures while the recruitment of panelists in probability-based panels is conducted off-line and is costly. As a result, the vast majority of Internet surveys are conducted via non-probability panels (i.e. access panels), and the revenue from commercial Internet surveys is steadily increasing and currently exceeds US$142 billion (ESOMAR 2024).
However, Internet-only surveys have drawbacks. First, the mode of collection (self-administered Internet questionnaires) induces non-coverage for general population surveys. While Internet surveys can maintain high-quality standards, they are accessible only to individuals with Internet access and sufficient digital literacy. As Internet usage expands across demographics, this limitation has diminished but not yet disappeared (Cabrera-Álvarez et al. 2025). Another critical issue arises with the use of “online” or access panels. Access panel surveys are based on non-probability recruitment that is often not well qualitatively and quantitatively documented, contrasting with probability-based panels like the Liss Panel (Scherpenzeel 2009), Elipss (Duwez and Mercklé 2022) or Konwledgepanel (El Malti et al. 2024). While the recruitment of panelists in the latter is conducted off-line, the recruitment of panelists in access panels generally uses a mix of online and offline procedures, which reinforces the required digital abilities of the population it reaches. There is also a growing concern about the quality of data from surveys conducted in access panels, due to a significant proportion of “bogus respondents”, associated with fraudulent, mischievous or insincere answers (Kennedy, Mercer, and Lau 2024).
There has been a lot of research, primarily focused on whether or not these access panels are able to provide reliable population estimates. Examination of the theoretical arguments opposing probabilistic and non-probabilistic surveys, as well as the more pragmatic arguments concerning recruitment methods and the practical conduct of surveys within panels, tend to lead to the conclusion that access panel surveys are less reliable (Cornesse et al. 2020, Cornesse and Blom 2020). Most empirical studies replicating probability surveys on access panels find less accurate population estimates than probability surveys, even for pre-election opinion polls (Sohlberg, Gilljam, and Martinsson 2017, Sturgis et al. 2018). Multivariable estimates may fare better (Pasek 2016, Rohr, Silber, and Felderer 2025), but significant discrepancies and even opposite associations can still occur (Legleye, Charrance, and Razafindratsima 2015, Brüggen, van den Brakel, and Krosnick 2016, Callegaro et al. 2014). Such studies often achieve high internal validity but lack external validity, as conclusions typically apply to specific panels or topics (Cornesse and Blom 2020): many studies found that the estimates vary across panels (Erens et al. 2014, Burkill et al. 2016, Kennedy et al. 2016, Lavrakas et al. 2022). Systematic comparisons show the limitations of the reweighting techniques used in access panels studies: usually, only simple margins are considered, leading to incorrect cross-margins (e.g. gender and age group) (Dutwin and Buskirk 2017, Pekari et al. 2022). This shortcoming, encourages the possibility of obtaining estimates far removed from those of the probabilistic reference surveys. There are, of course, more sophisticated techniques, including the use of probabilistic surveys to produce pseudo-weights and try to reduce the selection bias (Liu, Scholtus, and De Waal 2022, Eliott and Valliant 2017). But bias reductions are modest, depending (without a clear pattern) on the subject of the survey, the quotas and the panel involved (AAPOR 2013, Pekari et al. 2022, Erens et al. 2014, Pennay et al. 2018, Guignard et al. 2013, Legleye, Charrance, and Razafindratsima 2015, Kennedy et al. 2016, Brüggen, van den Brakel, and Krosnick 2016).
The mechanisms that may lead to bias in estimates of non-probability based online access panels mostly rely upon theoretical arguments (Mercer et al. 2017, Kohler 2019). When selection probabilities and confounders (variables associated with both the probability of survey response and to the studied outcomes) are unknown, there is a huge risk for the estimates from non-probability surveys to be biased (Mercer et al. 2017). As it is almost always possible to adjust a sample of respondents drawn from a non-probability survey so that it is very similar to the general population in terms of basic sociodemographic characteristics, the remaining biases in estimates are thus to be due to the fact that the selection mechanism is unknown and that some confounders are not controlled for. However, beyond this general limitation of non-probability sampling, it is very rare to be able to identify the confounding factors that are not observed or controlled, and that would allow us to understand the origin of the bias. Furthermore, demonstrating that a survey based on a single access panel presents significant biases compared to a probabilistic or administrative reference does not exclude the possibility that another survey, based on the same panel or a different panel, could produce different and perhaps better estimates, as the consistency of the panel recruitment mechanism is not guaranteed over time. Traditional statistical inference based on a single survey conducted within a particular access panel allows reliable conclusions to be drawn about that panel, but not about the general population of panelists, i.e., the population of all panels. This is why some methodological studies have combined replications of a given survey across multiple panels. However, this method does not allow for certainty in covering the diversity of panels.
If we could identify the general behaviors and attitudes of panelists that differentiate them overall from non-panelists and the population as a whole, regardless of their sociodemographic characteristics, we could understand why any study conducted on any panel is likely to produce biased estimates of the general population. A detailed description of the panelist population itself is thus needed, ideally obtained through a probability survey of the general population. A prior U.S. study (Boyle et al. 2017) attempted this but used a small sample (n=500) and limited its scope to basic sociodemographics, failing to explain the discrepancies in survey outcomes.
The present study builds on this literature by comparing panelists and non-panelists within a large-scale probabilistic sample of the French population, identifying sociodemographic characteristics and online behaviors that may explain recruitment biases in access panels in general. We also show an estimate of key indicators based on panelists’ responses alone, and compare them with those obtained for the general population via the full sample, in order to reproduce what would be obtained, in expectation, from a representative population of panelists and discuss the implications of our findings.
2. Methods
2.1 The ICT survey
The ICT household survey (survey on information and communication technologies) is an annual household survey conducted since year 2007 by the French national statistical institute (Insee). The survey uses a complex random sampling design using the demographic register of dwellings and individuals as sampling frame. This register is the result of the merger of numerous administrative and tax registers and lists both dwellings and individuals residing in France. With a coverage rate for dwellings over 99.5%, it serves as the sampling frame for all probabilistic surveys conducted by INSEE (Lamarche and Lollivier 2021). Each year, around 30,000 individuals aged 15 and more are randomly selected to answer the ICT survey about their Internet, landline and mobile telephone equipment and usage in continental France and in four overseas departments (Guyane, Martinique, Guadeloupe, Réunion) (Insee 2025). ICT uses a mixed-mode telephone and Internet/paper collection protocol. The survey covers people aged 15 and over, living in ordinary dwellings, one person per household in each dwelling being randomly surveyed. All contacts (invitations and reminders) are made by post (100% of addresses are known) and by email when possible (at least one email address is known for 80% of households). The ICT survey design addresses the risk of selection bias relative to data collection protocol. First, 38,999 households were randomly selected in the sampling frame, using a stratified systematic sampling method by cross-stratification of the management region (used to monitor the data collection) and the administrative region. The age of the reference person in the household (5 categories) and household income (5 categories) were used as sorting variables before sampling. The households without any known telephone number represented 21% of this initial sample: they had to respond by Internet or by paper and formed the initial NoT subsample. Among the households with a known telephone number, two groups were randomly formed: those who had to respond by Internet -or, failing that, by post- and were never contacted by telephone that formed the initial TI subsample (81%); and those who had to respond by telephone that formed the initial TT subsample (19%). As households with low income present a low response rate, an overrepresentation of them was made in each initial subsample, resulting in a reduction of the number of finally selected households: 99% in the initial NoT, 77% of the initial TI; 69% of the TT. The final number of selected households contacted for the survey was thus 31,291 (n=7,951 in the NoT, 19,450 in the TI and 3,890 in the TT subsample). The number of selected households in the four overseas departments was 3,540 (11% of the selected total).
Initial design weights were computed to account for these steps and for the random selection of the respondent within each household. After a quality check, 98.4% (n=14,892) of the completed questionnaires were retained (99.6%, 98.9% and 97.4% of those completed by telephone, Internet and by paper, respectively). Total nonresponse was modeled and corrected independently in each subsample using the homogeneous response groups method (Haziza and Beaumont 2007). The TT subsample has the highest response rate and is considered the benchmark for correcting suspected selection biases in the subsamples surveyed via the Internet: the TI and NoT subsamples were adjusted so that the proportions of households with a home Internet connection and Internet users in the last three months, by age group of the household reference person, were equal to those estimated in the TT respondent subsample. A final calibration based on population sociodemographic variables (sex by age category, education level, region and household living standard) is done. The response rate (number of respondents / number of individuals selected) was 56.5% (53.4% for TI and NoT and 77.4% for TT), based on the AAPOR formula 2 (AAPOR 2011).
More importantly, the absence of selection and measurement bias in the mixed-mode ICT survey was verified in 2021 using a replication of ICT using face-to-face questionnaires (Legleye, Viard-Guillot, and Nougaret 2022).
2.2 Identification of the panelists
The question used to identify the panelists was the following: [If the respondent has used Internet at least once; only one answer allowed] “Have you ever been a member of an online panel, i.e. regularly answered questionnaires on the Internet, usually in exchange for vouchers? (1. Yes, you are currently a member of an online panel; 2. Yes, you were once a member of an online panel, but you’re not anymore; 3. No, you don’t know what it’s like; 4. No, never; Don’t know, refusal). The question regarding motivation to register in a panel the first time was: “What motivated you to take part in your first panel? (1. Rewards, gift vouchers, discounts; 2. Advice from a friend or acquaintance; 3. Curiosity; 4. The feeling of being useful; 5. You like to give your opinion and express yourself; 6. Another reason; Don’t know/refusal)”.
2.3 Outcomes
Most of the outcomes come from questions that were asked only to Internet users. A series of 20 questions describing basic activities online (sending emails, consulting one’s bank account etc.) were asked only to the internet users in the last 3 months. Other sets of questions were asked to the Internet users in the last 12 months: 16 describing online purchases, 10 describing the use of administrative service online, 3 describing financial operations etc. We picked-up only some of these questions for this paper but similar results were obtained for the other questions. We wanted to capture the most general attitude towards self-expression online (including the few questions about expressing its political values and preferences), information seeking, financial operations. The questions are translated in Annex.
2.4 Analytical strategy
Percentages and means were used to describe the sample while Chi² tests, t-tests, Wilcoxon tests, and multivariable Poisson regressions with modified variance (Zou 2004) were used to compare the panelists to the remaining interviewees for a set of behaviors with risk ratios (RR). The significance threshold was set at 0.05: all results presented in the text had a p-value below. Controls in the multivariable analyses (hereafter named ‘ceteris paribus’) were: sex, age (introduced in splines), education (4 levels), quintile of standard of living, affective situation (3 categories: in couple with someone inside / outside the dwelling, not in couple), number of children under 14, and urban unit size (5 categories). Additional controls were introduced when relevant: frequency of internet use (less than once a week, at least one time a week, one time each day, multiple times each day), mode of collection (3 categories: telephone, internet and paper). For the study of the use of administrative and of financial services online, the number of basic online activities (out of 20, see Annex Set of questions 1) was also added; for the study of administrative claims, the number of administrative services used was also added.
To ensure that the apparent differences between panelists and the rest of the sample were not partially due to the mode of collection, we systematically replicated the analyses to Internet respondents only (whatever their initial allocated subsample was: TT, TI or NoT). This eliminates the classic social desirability and satisficing biases that can affect comparisons between self- and hetero-administered samples (De Leeuw 2008, Sakshaug, Cernat, and Raghunathan 2019, AAPOR 2020, Buelens and Brakel 2010).
To produce the estimates that one would obtain whether only the panelists were interviewed (as in a fictional access-panel survey), we used inverse probability weighting. We duplicate the panelists and create a composite database comprising the whole ICT sample on the one hand, and the duplicated panelists on the other, keeping the original ICT weights. Using a weighted logistic regression, we modeled the probability of being in the duplicate panelists sample (instead of the ICT base), controlling for age (introduced in splines), sex, education, quintile of standard of living, living in couple, number of children under 14, and urban unit size (with age introduced in splines). Based on this predicted probability, we calculate the ATC weighting (average treatment for the controls), which consists in leaving the ICT weighting unchanged and modifying that of the duplicated panelists to make them resemble the ICT sample, i.e. the target population (Austin and Stuart 2015). Standard mean deviations (SMD) were computed to assess the final differences between the ICT sample and the duplicated ATC-weighted panelists subsample for sociodemographics: all were below 20, a common accepted threshold (Austin and Stuart 2015). Note that this process restricts the analysis either to the last 12 months internet users or to the last 3 months internet users, depending on the outcomes.
As the number of panelists in the ICT respondents’ sample is below 1,000, we do not show decimals for the percentages; however, we keep two decimals for the risk ratios and confidence intervals. All statistics were computed using final calibrated weights, accounting for the selection probability (of the household and of the individual within the household) and the total non-response correction. There were almost no item missing values (less than 0.1% for each outcome or sociodemographic variables).
3. Results
Note that for all the behaviors studied hereafter, no significant difference has been observed in the multivariable analyses between current and former panelists or between panelists reporting that their motivation for their first enrollment in a panel was the motivation for additional income (n=257) and the other panelists (n=455).
3.1 Panel registration
Of the 14,892 respondents, 89.3% (n=12,899) have used Internet in their lifetime: 85.4% within the last three months, 1.4% within the last year and 2.5% previously. The questions relating to the panels were asked only to the lifetime Internet users. In total, 712 people said they were or had been members of a panel (227 currently, 485 previously) and 1,643 said that they do not know what a panel is. There was no missing value to this question. The general population of panelists thus represent 5.5% of the French population aged 15 and more (including 1.8% of current panelists), and 6.2% of lifetime Internet users (including 2.0% of current panelists). The proportion of respondents ignoring what an access panel is was 13.8% among the ever Internet users: this proportion decreased with the frequency/recency of Internet use (13.6% for the users in the last 3 months, 18.0% among those who used Internet previously in their life).
Panelists were more often women (62% vs. 53%) and lived more often with a partner (62% vs. 55%), in larger households (2.9 vs. 2.6 members on average) and had higher education levels (6.5 vs. 5.1 on average, on a scale of 1 to 11). They were more likely to be working (67% vs. 51%) or studying (11% vs. 9%). Their household living standards did not differ significantly. They were younger (mean= 41 vs. 50 years, median=39 vs.50), the difference being most pronounced at older ages: the first decile is common to both groups (22 years), and the 90th decile is higher for non-panelists (76 years vs. 63 years), meaning that the age rank 15-63 comprises 90% of the panelists in the general population.
3.2 Mode of collection for response and sociodemographic profile of panelists
Overall (Table 1), panelists were concentrated among Internet respondents (8% vs. 4% among paper and telephone respondents, p<0.001). In the “ceteris paribus” multivariable analysis (Table 2), women were significantly more likely to report being or having been panelists than men (RR=1.58 [1.37; 1.82]), as were students relative to those employed (RR=1.73 [1.21; 2.48]). While income had no marked overall effect except that relatively to people whose standard of living is in the fifth quintile, all others were around 15% more likely to be panelists (RR=1.15 [0.99; 1.34], p=0.074). In contrast, the effect of education level is relatively linear, with the probability of being a panelist increasing with the level of the diploma. The probability of being a panelist was slightly higher in the Paris urban area than elsewhere (RR=1.18 [0.99; 1.40], p=0.064) and lower in large urban areas than in Paris’ one. The association between being a panelist and the mode of collection is confirmed, with panelists concentrated among Internet respondents rather than telephone respondents (RR=1.62 [1.32; 2.00]).
Table 1: Distribution of the panelists by effective mode collection
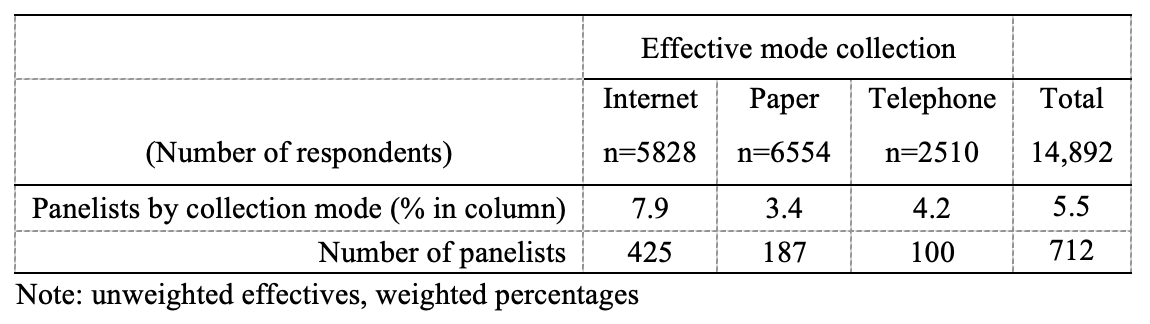
Table 2: Associated factors to register in a panel during life (risk ratios and 95% confidence intervals)
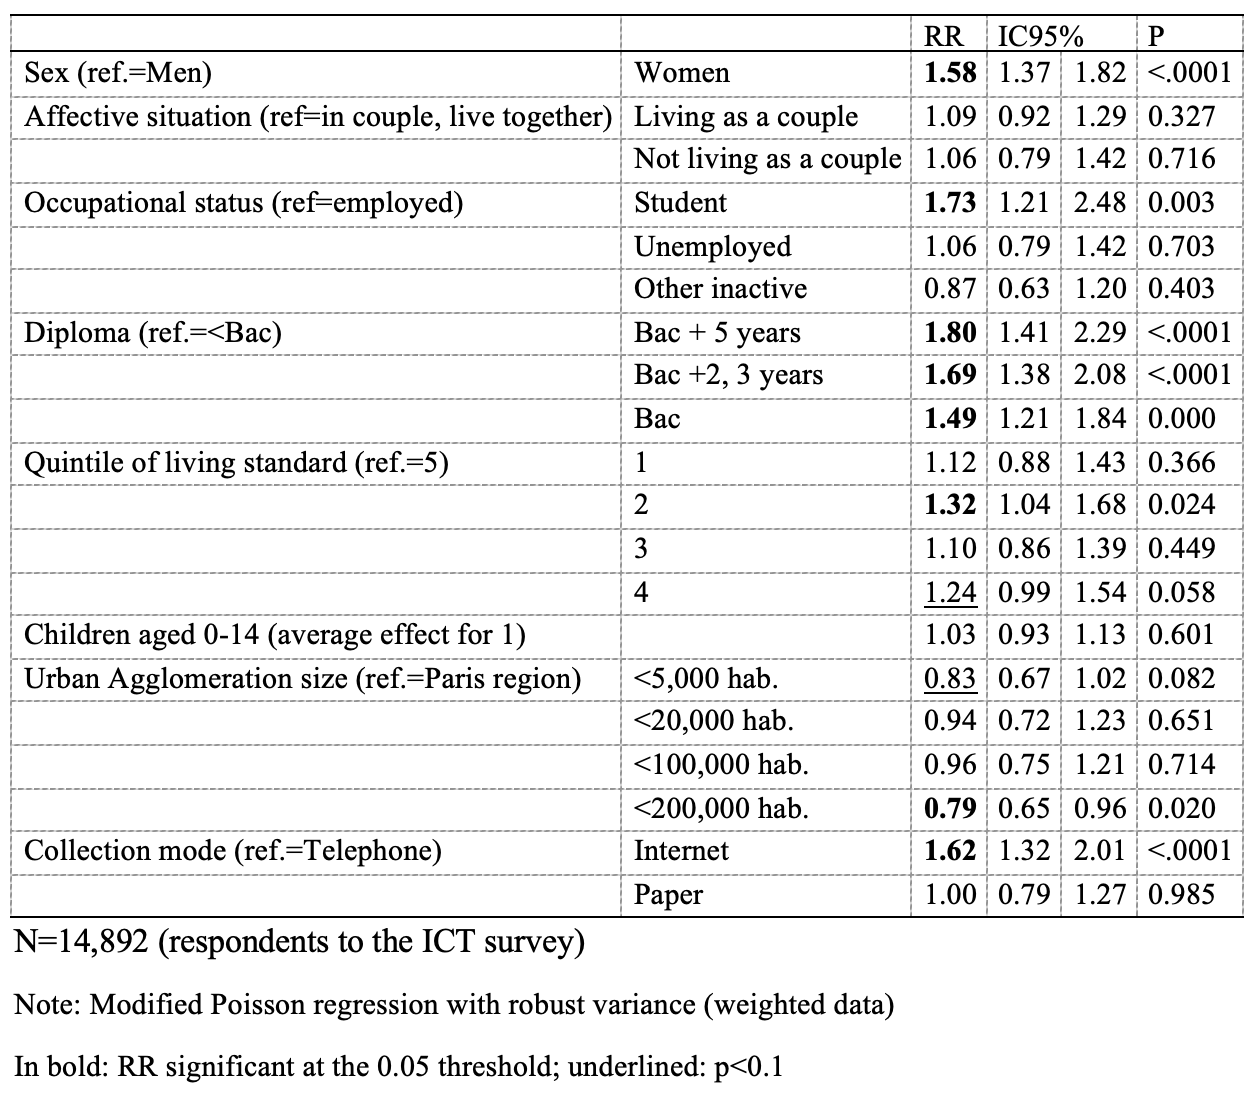
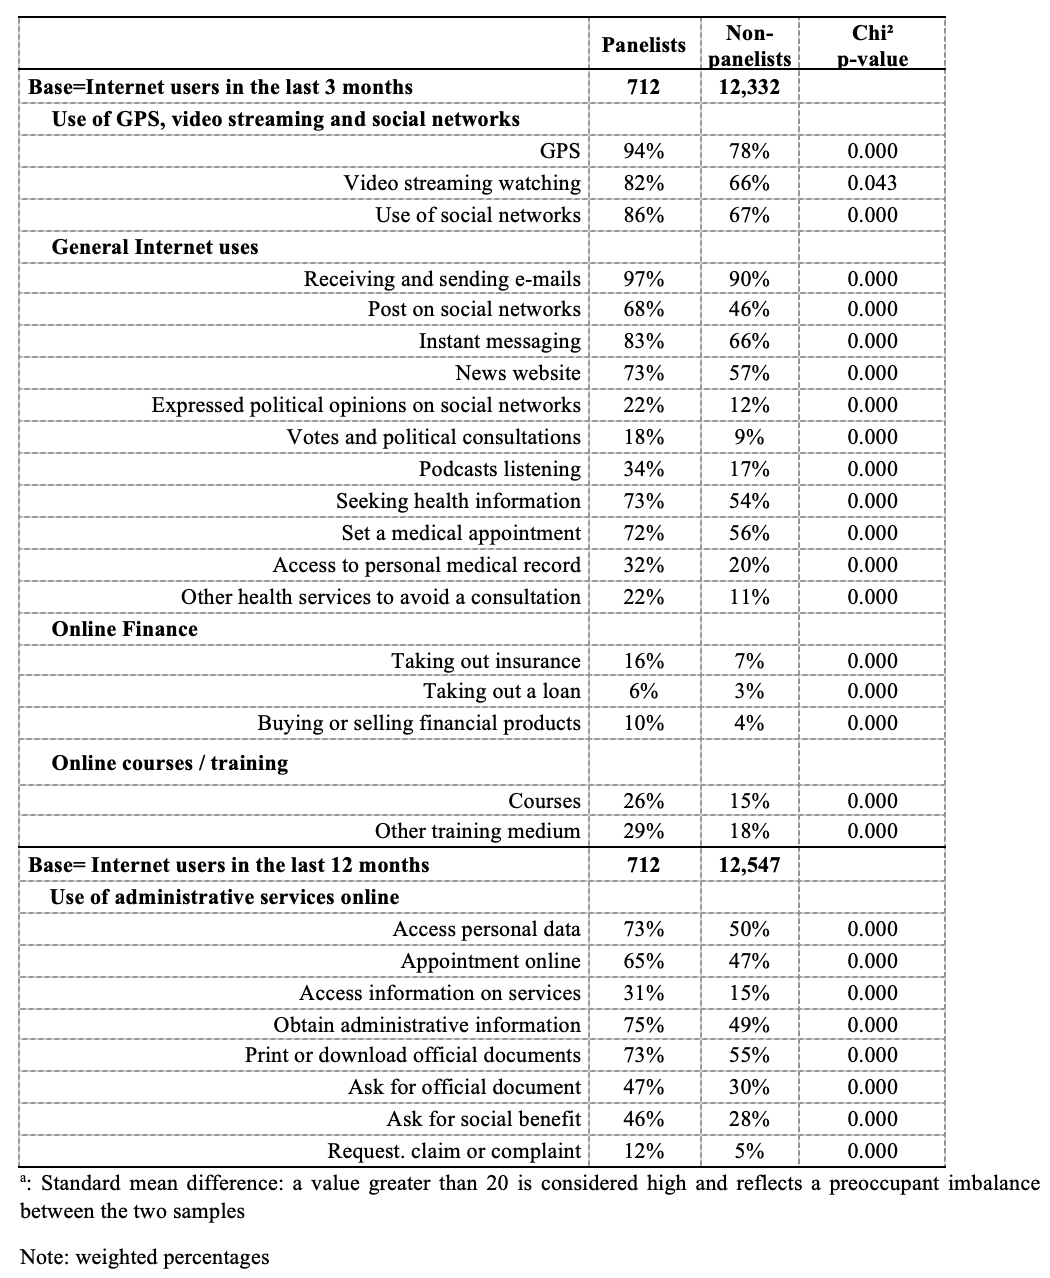
Table 3: Online behaviors of panelists and non-panelists
3.3 Panelists’ reasons for registering
The desire to increase income was the main reason to enroll in a panel (cited by 78% of panelists, and as unique reason for 39% of them: n=257), far ahead of curiosity (35%) and the desire to express oneself (29%) or to be useful (20%). Recommendations from friends were cited very rarely (7%).
3.4 More diverse, active and militant Internet use
Unsurprisingly, panelists were more likely to use the Internet: 93% were daily users, versus 70% of non-panelists. They were more likely to use GPS and mapping systems (94% vs. 78%), streaming services (82% vs. 66%), and social networks (86% vs. 67%) (See Table 3). These results remained ceteris paribus (see Section 2.4).
Among Internet users over the last 3 months (Table 3), panelists reported more Internet activities over the past 3 months: 12.0 vs. 9.1 on average (out of 20 possible activities listed in Annex, set of questions number 2, p<0.001). The differences were notable for publishing content (posts) on social networks (68% vs. 46%), using instant messaging (83% vs. 66%), consulting news or information sites (73% vs. 57%), expressing opinions on civic or political issues via websites or social media (22% vs. 12%), taking part in online consultations or votes on civic or political issues (18% vs. 9%), listening to or downloading podcasts (33% vs. 17%) or seeking health information (72% vs. 54%).
These differences hold ceteris paribus (with additional controls): for example, panelists used more often instant messaging (RR=1.10 [1.02; 1.19]) and social networks (RR=1.31 [1.20; 1.42]). But above all, they expressed their political opinions more often than the others via these media: RR=1.61 [1.36; 1.89] for the expression of political opinions and RR=1.64 [1.38; 1.95] for votes or online political consultations. For consulting news sites, the difference with non-panelists was lower (RR=1.13 [1.04; 1.24]) but panelists more often informed or entertained themselves via podcasts (RR=1.49 [1.31; 1.69]) and they more often search for medical information (RR=1.22 [1.12; 1.33]).
Panelists were also more likely to have carried out financial transactions: taken out insurance (16% vs. 7%), taken out a loan (6% vs. 3%), bought or sold financial products (10% vs. 4%). They report more often having taken part in online training: in a course (26% vs. 15%), in a training medium or aid other than a course (29% vs. 18%). These differences persisted ceteris paribus (RR=1.30 [1.13; 1.51] for courses and RR=1.33 [1.16; 1.53] for training aids).
3.5 A more active use of administrative services online
Among Internet users in the last 12 months, panelists reported more often a large series of administrative actions on official administrative websites in the last 12 months: accessing personal data (73% vs. 50%), printing an official information or application (73% vs. 55%); requesting an official personal document (47% vs. 30%); requesting a social benefit (46 % vs. 27%); making requests, claims or complaints (12% vs. 5%). Again, these differences persist ceteris paribus (with additional controls).
3.6 Robustness to mode of collection
Restricting the analysis to the Internet respondents only let the results almost unchanged. For example, RR=1.59 [1.29; 1.95] for political expression (vs. RR=1.61 [1.36; 1.89]), RR=1.44 [1.15; 1.18] for online vote (vs. RR=1.64 [1.38; 1.95]), RR=1.14 [1.02; 1.27] for visiting news sites (vs. RR=1.13 [1.04; 1.24]), RR=1.40 [1.19: 1.65] for listening to podcasts (vs. RR=1.49 [1.31; 1.69]) and RR=1.22 [1.08; 1.36] for seeking medical information (vs. RR=1.22 [1.12; 1.33]). The same was true for all the analyses above.
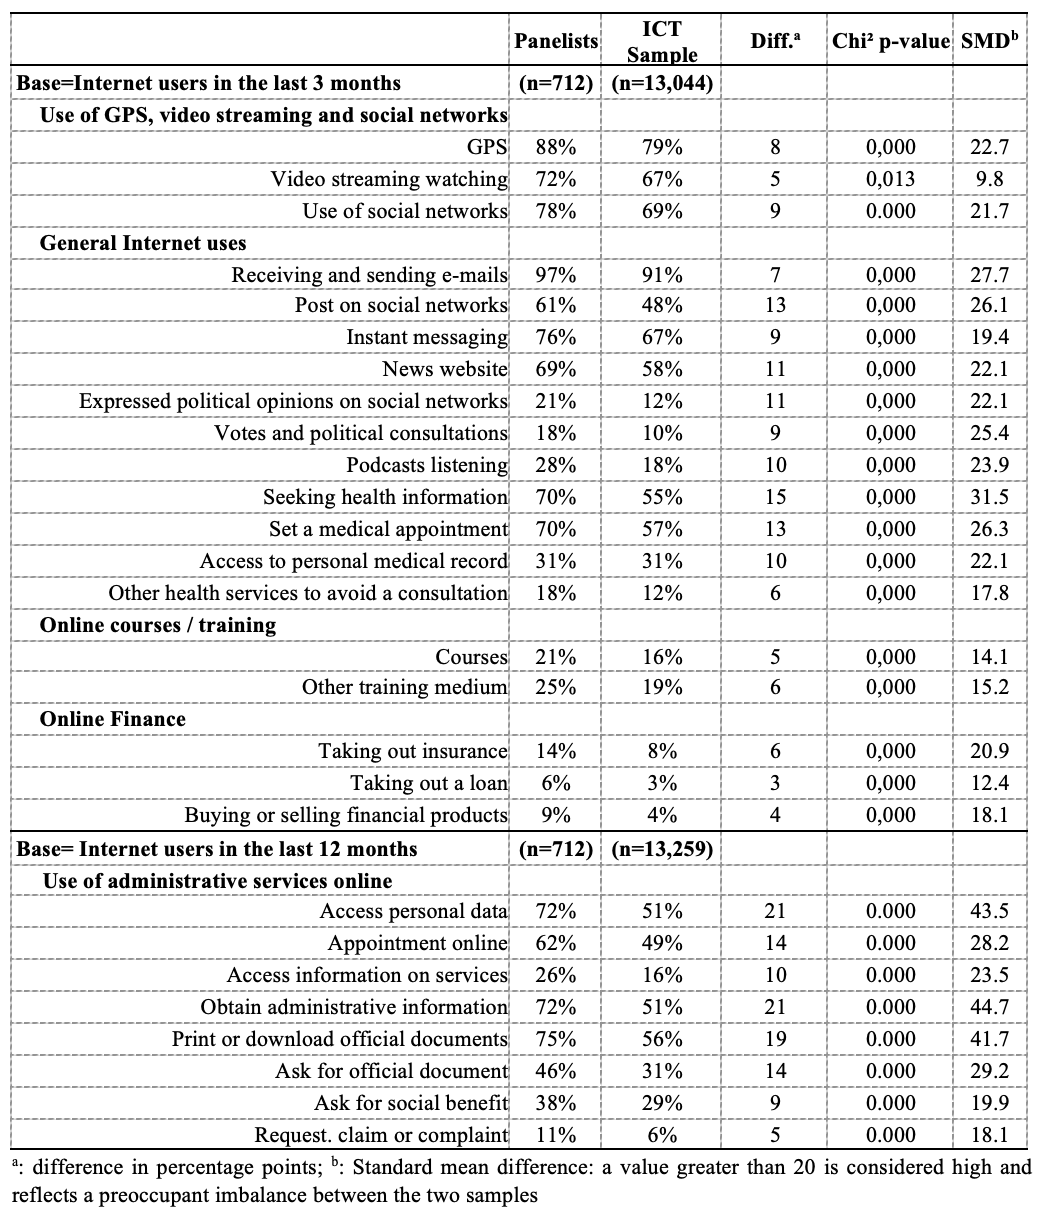
3.7 What would be measured if we only surveyed panelists to represent the Internet users?
To estimate the counterfactual measures that would be obtained if we interviewed only (current or past) panelists to represent the Internet users (comprising the panelists), we used the ATC weighting procedure described in section 2.4. It makes the subsample of panelists resemble the general population, as represented by the ICT sample as a whole, for a large set of sociodemographic characteristics: the standardized differences for the sociodemographics were all below 10 except for one category of standard of living (Table 4). Doing this, almost all the counterfactual estimates were significantly different from those obtained with the whole ICT sample (Table 4). In accordance with the multivariate results shown above, differences were particularly significant for active and militant uses of the Internet: searching for health information (70% in panelists vs. 55% in the general population of internet users), political expression and voting online (21% vs. 12% and 18% vs. 10%, respectively), use of social networks (78% vs. 69%) and posts on social networks (61% vs. 48%), taking online training courses (21% vs. 16%) or financial transactions online, etc. The differences were also marked for the use of administrative services online: for accessing personal data (72% vs. 51%), obtaining administrative information (72% vs. 51%) etc.
Table 4: Inverse probability weighting of the panelists’ subsample
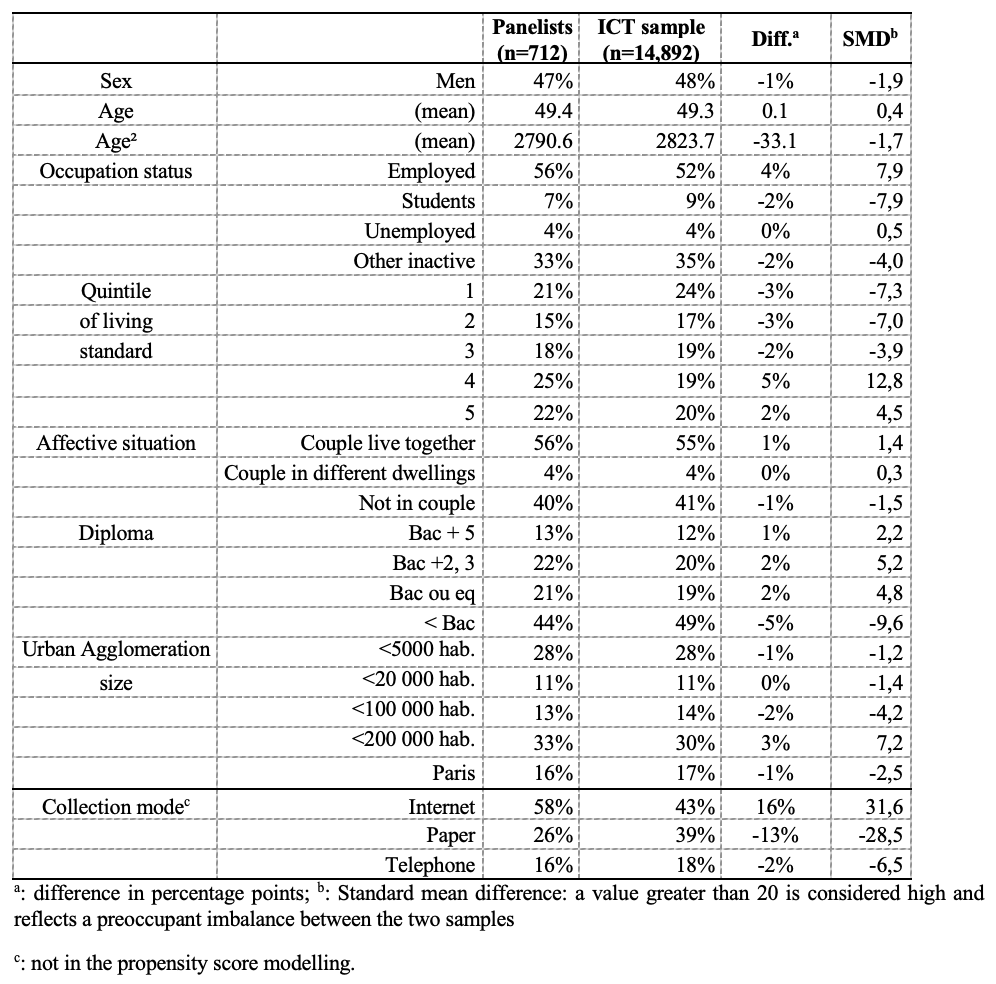
Table 5: Counterfactual estimation of Internet uses in panelists
4. Discussion and concluding remarks
Our study is the first in France to describe the general population of access panelists, rather than the members of a single panel, using a high-quality probabilistic and mixed-mode survey of the general population aged 15 and over. One strength of this study is its reliance on a large probabilistic survey with a high response rate, which proved to be immune to the measurement and selection biases that can affect online or mixed-mode surveys (Legleye, Viard-Guillot, and Nougaret 2022).
We found that, from a socio-demographic point of view, panelists and non-panelists appeared similar, with the exception of age and diploma, the former being younger and more educated than the latter. However, our multivariable analyses, using a large set of control variables including age, revealed many significant behavioral differences between the two groups. The general population of panelists differ from the general population in their comfort with the Internet, using it in a more diversified, efficient, and secure manner. They are more proficient in administrative and financial procedures and more capable of asserting their rights, obtaining information, campaigning, and expressing themselves politically. Restricting our analyses to Internet respondents only confirmed these findings: the population of panelists is a biased selection of the general population based on their particular use of the Internet, not the frequency of use or time spent, but the purposes of their use. In other words, the selection of access panelists occurs according to a non-ignorable mechanism (Rubin and Little 2002). This suggests that samples of panelists, even when calibrated to the target population margins, cannot accurately estimate the prevalence of a wide range of online behaviors, and outcomes strongly associated with these online behaviors.
While past methodological studies have shown discrepancies between access panel samples and the general population, their results cannot generalize to all panels since each is not a probability sample of the general population of the panelists. The study by Boyle et al. (2017) showed that the population of the panelists differed in terms of sociodemographics. Our study adds that the population of panelists is highly selective, not so much according to socio-demographic criteria, but rather because of their use of the Internet and their attitudes towards information and politics. Like previous theoretical and empirical studies published on the quality of non-probabilistic Internet surveys, our study does not totally rule out that a study conducted within a single panel might occasionally produce accurate indicators for some behaviors. However, our findings suggest that this is highly unlikely, as the specific relationship to information and politics displayed by panelists is very pronounced and will have consequences for a wide range of themes. We thus believe that our study, by identifying a very general and measurable characteristic of access panel members, helps to strengthen the persuasive power of the classical theoretical arguments against panels.
This study has several limitations. The small sample size made it difficult to distinguish between current and former panelists, and we had only a limited set of questions regarding panel membership, all focusing on Internet use or online behaviors. However, the specific behaviors we identified are very general and relate to the relationship with information, politics, and self-expression. Therefore, they can affect and bias the study of a wide range of subjects related to those, including off-line behaviors.
Second, although we intended to study the non-probability panels, our question identifying the panelists does not clearly distinguish non-probability from probability panels, and commercial from non-commercial panels or even from longitudinal health surveys. When the ICT survey was conducted in 2022, the ELIPSS panel was the only probability panel in France, and it comprised 2,200 members (Duwez and Mercklé 2022) while the KnowledgePanel was launched in 2024 with 15,000 members (El Malti et al. 2024). Two large cohort had existed since 2016: a non-probability online survey focusing on nutrition claiming 180,000 current or former members in 2025 (Drewnowski and Fulgoni 2025, Kesse-Guyot et al. 2013) and a health survey whose sample was mostly drawn in the national health insurance registry claiming 220,000 current and formers members in 2025 (Zins, Goldberg, and team 2015). But these are specialized scientific surveys with no incentives and could not, a priori, be confused with an access panel. It is hard to find detailed numbers of members of commercial non-probability panels but in 2025, adding the public numbers of only two French companies leads to at least 2.3 million panelists (Creatests 2025, Harris Interactive 2024) and there are dozens of them (the official records comprise 2,258 companies conducting market research in France in 2020 (Insee 2021). We can thus be confident that the vast majority of panelists in the ICT survey were active in access panels.
The third limitation is the fact that the sample concerns France only, a western country with a high rate of Internet use (World Bank 2025) and a long tradition of polls and surveys. Although these economic and cultural traits are common in western countries, transferring our results to other regions of the world may be difficult.
Consistent with previous findings (Keusch, Batinic, and Mayerhofer 2014), we found that the main reason for joining a panel was to increase one’s income, cited by 78% of panelists and the sole reason for 39% of them. Our data did not show a significant association of this motive for registering with any specific behavior among panelists but this result may be challenged with a larger sample: direct questions about panelists’ incomes during their active participation could shed light on the issue. Our study did not aim to investigate the motivations of panelists beyond providing a summary description of the main motivations for initial registration. In particular, motivations may vary over time, shifting from an extrinsic motivation dominated by the lure of financial gain to a more intrinsic motivation dominated by a sense of social or economic utility or curiosity and enjoyment in responding to a variety of questionnaires, many parameters being associated with the initial and the long-term participation (Keusch 2015). It’s worth mentioning that an in-depth journalistic study published in a major national newspaper and carried out in late 2021 in France showed that claims of quality control (checking identity, duplicates, etc.) in panels were largely unfounded, as none of the multiple registrations under false identities were detected during the registration process and solicitations to take part in surveys were often much more frequent than stated in the panels’ internal regulations (Bronner 2021). These findings corroborate the results of a quantitative survey held in the US: reports of insincere and fraudulent sociodemographic characteristics were common in some minority groups or those with low socioeconomic status (Kennedy, Mercer, and Lau 2024). It is therefore likely that the promises of financial gain offered by access panels contribute to recruiting members who are less scrupulous about the quality of their responses, at least for some time, before changes in behavior can eventually correct this (either by quitting or changing one’s attitude). The ICT methodology completely excludes duplicates and virtually eliminates false socio-demographic declarations. The respondent sample is also relatively immune to measurement bias, and the brevity of the questionnaire and the non-sensitive nature of the questions further exclude social desirability or satisficing bias. It contains a probabilistic sample of the general population, members of access panels included, so the behavioral differences observed are truly attributable to personal characteristics specific to panelists in general, and not to a subsample of novice or long-time panelists or those who are (temporarily) unscrupulous in their responses.
Finally, the complex weighting process of ICT was designed to balance the Internet equipment rate and the frequency of Internet use of the respondents of all subsamples, considering the telephone respondent TT subsample as a benchmark. In spite of this, we found that the proportion of panelists was higher in the subsample that responded on Internet than in those who responded by telephone, although the two were selected or by paper. This raises a doubt: respondents who are used to answering surveys in an online self-administered mode might have chosen not to participate by telephone and paper, therefore leading to selective non-response. It certainly results in an underestimation of the proportion of panelists in the general population. However, our main results concern the specific online behaviors of the panelists and were obtained adjusting for a large series of controls including the data collection mode and the frequency of Internet use; it is likely that they would not be changed with a different weighting scheme. Nevertheless, we acknowledge that this suggests that some improvement in the weighting scheme could be made.
As Tourangeau reports, “the combination of coverage, selection, and nonresponse errors has greater cumulative effects than nonresponse error alone” (Tourangeau 2020), leading to greater total error in access panel surveys than in probability surveys, even those with low response rates.
Access panelists differ from the general population of Internet users, and they differ even more from the general population, a significant proportion of whom lack ordinary Internet access or the skills required to be regular Internet users. Surveys requiring accurate general population estimates should avoid relying solely on access panels.
Annex: List of questions
References
- AAPOR. 2011. Standard Definitions: Final Dispositions Of Case Codes And Outcome Rates For Surveys: AAPOR.
- AAPOR. 2013. Report of the AAPOR task force on non-probability sampling. AAPOR.
- AAPOR. 2020. Transitions from Telephone Surveys to Self-Administered and Mixed-Mode Surveys. AAPOR.
- Bianchi, A, S Biffignandi, and P Lynn. 2017. “Web-Face-to-Face Mixed-Mode Design in a Longitudinal Survey: Effects on Participation Rates, Sample Composition, and Costs.” Journal of Official Statistics no. 33 (2):385-408. doi: 10.1515/jos-2017-0019.
- Bronner, Luc. 2021. “Dans la fabrique opaque des sondages.” Le Monde, 4 novembre.
- Brüggen, E, Jan van den Brakel, and JA Krosnick. 2016. Establishing the accuracy of online panels for survey research. In CBS Discussion Paper. The Hague: Statistics Netherlands.
- Buelens, Bart, and Jan van Brakel. 2010. “On the Necessity to Include Personal Interviewing in Mixed-Mode Surveys.” Survey Practice no. 3 (5). doi: 10.29115/SP-2010-0023.
- Burkill, S, A Copas, MP Couper, S Clifton, P Prah, J Datta, F Conrad, K Wellings, AM Johnson, and B Erens. 2016. “Using the Web to Collect Data on Sensitive Behaviours: A Study Looking at Mode Effects on the British National Survey of Sexual Attitudes and Lifestyles.” PLoS One no. 11 (2):e0147983. doi: 10.1371/journal.pone.0147983.
- Cabrera-Álvarez, Pablo, Jonathan Burton, Annette Jäckle, Gabrielle B Durrant, Jamie Moore, and Peter Smith. 2025. Who is still offline? An analysis of web non-users and web non-respondents with a longitudinal perspective. In European survey research association. Utrecht.
- Callegaro, Mario, Ana Villar, David Yeager, and Jon A Krosnic. 2014. “A critical review of studies investigating the quality of data obtained with online panels based on probability and nonprobability samples.” In Online Panel Research: A Data Quality Perspective, edited by Mario Callegaro, Reg Baker, Jelke Bethlehem, Anja S. Göritz, Jon A Krosnic and P.J. Lavrakas. Wiley.
- Cornesse, Carina, and A.G Blom. 2020. “Response Quality in Nonprobability and Probability-based Online Panels.” Sociological Methods and Research. doi: 10.1177/0049124120914940.
- Cornesse, Carina, Annelies G Blom, David Dutwin, Jon A. Krosnick, Edith D. de Leeuw, Stéphane Legleye, Andrew Mercer, Josh Pasek, Darren Pennay, Benjamin Philips, Joseph W. Sakshaug, Bella Struminskaya, and Alexander Wenz. 2020. “A Review of Conceptual Approaches and Empirical Evidence on Probability and Nonprobability Sample Survey Research.” Journal of survey statistics and methodology no. 8 (1):4-36. doi: 10.1093/jssam/smz041.
- Creatests. 2025. Notre Panel de consommateurs : obtenez rapidement des réponses de qualité. Creatests 2025 [cited August 2025]. Available from https://www.creatests.com/nos-access-panels.
- De Leeuw, Edith D. 2008. “Choosing the method of data collection.” In International handbook of survey methodology, edited by Edith D De Leeuw, Joop J Hox and Don A Dillman, 117-135. New York: Lawrence Earlbaum Associates.
- Drewnowski, A., and V. L. Fulgoni, 3rd. 2025. “Should Atypical and Non-Representative Studies Such as NutriNet Sante Be Used to Drive Public Health Policy?” Nutrients no. 17 (16). doi: 10.3390/nu17162581.
- Dutwin, David, and Trent D Buskirk. 2017. “Apples to oranges or gala versus golden Delicious? Comparing data quality of nonprobability Internet samples to low response rate Probability samples.” Public Opinion Quarterly no. 81:213-249. doi: 10.1093/poq/nfw061.
- Duwez, Emmanuelle, and Pierre Mercklé, eds. 2022. Un panel français: l’Étude longitudinale par Internet pour les sciences sociales (Elipss) [A French panel: the Internet Longitudinal Study for the Social Sciences (Elipss)], Grandes enquêtes: Ined Éditions.
- El Malti, Farah, Cristina Tudose, Christophe David, Femke Dekeulenaer, Joke Depraetere, Valerie Blineau, and Alban Cordier. 2024. Le panel probabiliste en ligne, une alternative aujourd’hui accessible ! [The online probabilistic panel, an alternative that is now accessible]. In XIIIème Colloque francophone sur les sondages. Esch-Belval.
- Eliott, Michael R, and Richard Valliant. 2017. “Inferences for nonprobability samples.” Statistical Science no. 32 (2):249-264. doi: 10.1214/16-STS598.
- Erens, B, S Burkill, MP Couper, F Conrad, S Clifton, C Tanton, A Phelps, J Datta, CH Mercer, P Sonnenberg, P Prah, KR Mitchell, K Wellings, AM Johnson, and AJ Copas. 2014. “Nonprobability Web surveys to measure sexual behaviors and attitudes in the general population: a comparison with a probability sample interview survey.” J Med Internet Res no. 16 (12):e276. doi: 10.2196/jmir.3382.
- ESOMAR. 2024. Global market research. Esomar.
- Guignard, R, JL Wilquin, JB Richard, and F Beck. 2013. “Tobacco smoking surveillance: is quota sampling an efficient tool for monitoring national trends? A comparison with a random cross-sectional survey.” PLoS One no. 8 (10):e78372. doi: 10.1371/journal.pone.0078372.
- Harris Interactive. 2024. Avec les sondeurs d’Harris interactive : “Les périodes électorales, ce sont les moments que je préfère” [With Harris Interactive pollsters: “Election periods are my favorite times.”]. AEF.
- Haziza, David, and Jean-François Beaumont. 2007. “On the Construction of Imputation Classes in Surveys.” International statistical review no. 75 (1):25-43. doi: 10.1111/j.1751-5823.2006.00002.x.
- Insee. 2025. Fiches sectorielles – 2020. Élaboration des Statistiques Annuelles d’Entreprises (Ésane) [Sector fact sheets – 2020. Compilation of Annual Business Statistics (Ésane)]. Insee 2021 [cited August 2025]. Available from https://www.insee.fr/fr/statistiques/6799686?sommaire=6799850&q=etudes+de+marche+et+sondages.
- Insee. 2025. Household annual survey on information and communication technologies 2021 Insee 2025 [cited August 2025 2025]. Available from https://www.insee.fr/en/metadonnees/source/operation/s2103/presentation.
- Kennedy, Courtney, Andrew Mercer, Scott Keeter, Nick Hatley, Kyley McGeeney, and Alejandra Gimenez. 2016. “Evaluating Online Nonprobability Surveys.”
- Kennedy, Courtney, Andrew Mercer, and Arnold Lau. 2024. “Exploring the assumption that commercial online nonprobability survey respondents are answering in good faith.” Survey methodology no. 50 (1):3-21.
- Kesse-Guyot, E., V. Andreeva, K. Castetbon, M. Vernay, M. Touvier, C. Mejean, C. Julia, P. Galan, and S. Hercberg. 2013. “Participant profiles according to recruitment source in a large Web-based prospective study: experience from the Nutrinet-Sante study.” J Med Internet Res no. 15 (9):e205. doi: 10.2196/jmir.2488.
- Keusch, Florian. 2015. “Why do people participate in Web surveys? Applying survey participation theory to Internet survey data collection.” Management review quarterly (65):183-216. doi: 10.1007/s11301-014-0111-y.
- Keusch, Florian, Bernad Batinic, and Wolfgang Mayerhofer. 2014. ” Motives for Joining Nonprobability Online Panels and Their Association with Survey Participation Behavior.” In Online Panel Research: A Data Quality Perspective, edited by Anja S. Göritz, Jelke Geert Bethlehem, Paul J Lavrakas, Reginald P Baker and Jon A Krosnick, 171-191. Chichester, England: John Wiley & Sons.
- Kohler, Ulrich. 2019. “Possible Uses of Nonprobability Sampling for the Social Sciences.” Survey Methods: Insights from the Field. doi: 10.13094/SMIF-2019-00014.
- Lamarche, Pierre, and Stéphan Lollivier. 2021. “Fidéli, l’intégration des sources fiscales dans les données sociales [Fidéli, integrating tax sources into social data].” Courrier des statistiques no. 6:28-46.
- Lavrakas, P.J., Darren Pennay, Dina Neiger, and Benjamin Philipps. 2022. “Comparing Probability-Based Surveys and Nonprobability Online Panel Surveys in Australia: A Total Survey Error Perspective.” Survey Research Methods no. 16 (2):541-266. doi: 10.18148/srm/2022.v16i2.7907.
- Legleye, S, L Viard-Guillot, and A Nougaret. 2022. Correction des effets de mode et biais de sélection : les apports d’une expérimentation de l’enquête TIC (technologies de l’information et de la communication) en face-à-face [Correction of data collection mode effect and selection bias: an experiment with the ICT survey (Information and communication technologies)]. In Journées de méthodologie statistique de l’Insee. Paris: Insee.
- Legleye, Stéphane, Géraldine Charrance, and Nicolas Razafindratsima. 2015. “The use of a non-probability Internet panel to monitor sexual and reproductive health in the general population.” Sociological Methods and Research no. 47 (2):314-348. doi: 10.1177/0049124115621333
- Liu, An-Chiao, Sanders Scholtus, and Ton De Waal. 2022. “Correcting selection bias in big data by pseudo-weighting.” Journal of Survey Statistics and Methodology (00):1-23. doi: 10.1093/jssam/smac029.
- Mauz, Elvira, Elena von der Lippe, Jennifer Allen, Ralph Schilling, Stephan Müters, Jens Hoebel, Patrick Schmich, Matthias Wetzstein, Panagiotis Kamtsiuris, and Cornelia Lange. 2018. “Mixing modes in a population-based interview survey: comparison of a sequential and a concurrent mixed-mode design for public health research.” Archives of public health no. 76 (8):1-17. doi: 10.1186/s13690-017-0237-1.
- Mercer, Andrew, Frauke Kreuter, Scott Keeter, and Elizabeth A Stuart. 2017. “Theory And Practice In Nonprobability Surveys; Parallels Between Causal Inference And Survey Inference.” Public Opinion Quarterly no. 81 (Special issue):250-279. doi: 10.1093/poq/nfw060.
- Narayan, Sastry, and Katherine A McGonagle. 2021. “Switching from Telephone to Web-First Mixed-Mode Data Collection: Results from the Transition into Adulthood Supplement to the US Panel Study of Income Dynamics.” Journal of the Royal Statistical Society: Series A (Statistics in Society) no. 185 (3):933-954. doi: 10.1111/rssa.12840.
- Pasek, Josh. 2016. “When will nonprobability surveys mirror probability surveys? Considering types of inference and weighting strategies as criteria for correspondence.” International Journal of Public Opinion Research no. 28:269-291.
- Pekari, Nicolas, Lipps, Oliver, Roberts Caroline, and Lutz Georg. 2022. “Conditional distributions of frame variables and voting behaviour in probability‐based surveys and opt‐in panels.” Swiss Political Science Review, 28(4), 696-711.
- Pennay, DM, D Neiger, PJ Lavrakas, and K Borg. 2018. The Online Panels Benchmarking Study: a Total Survey Error comparison of fndings from probability-based surveys and nonprobability online panel surveys in Australia. In CSRM & SRC METHODS PAPER, edited by Matthew Gray. Canberra: Australian National University.
- Rohr, Bjorn, Henning Silber, and Barbara Felderer. 2025. “Comparing the Accuracy of Univariate, Bivariate, and Multivariate Estimates across Probability and Nonprobability Surveys with Population Benchmarks.” Sociological Methodology. doi: 10.1177/00811750241280963.
- Rubin, Donald B, and Roderick J. A Little. 2002. Statistical Analysis with Missing Data, Wiley Series in Probability and Statistics. Hoboken: John Willey & Sons.
- Sakshaug, Joseph W., Alexandru Cernat, and Trivellore E Raghunathan. 2019. “Do sequential Mixed-Mode surveys decrease non-response bias, measurement error bias and total bias? An experimental study.” Journal of survey statistics and methodology no. 7 (4):545-571. doi: 10.1093/jssam/smy024.
- Scherpenzeel, Annette C. 2009. Start of the LISS panel: Sample and recruitment of a probability-based Internet panel http://www.lissdata.nl/assets/uploaded/Sample_and_Recruitment.pdf.
- Sohlberg, Jacob, Mikael Gilljam, and Johan Martinsson. 2017. “Determinants of polling accuracy: the effect of opt-in Internet surveys.” Journal of Elections, Public Opinion and Parties. doi: 10.1080/17457289.2017.1300588.
- Soullier, Noémie, Loïc Garras, Marie Houot, and Corinne Pilorget. 2023. Pushing to Web Populations less prone to answer: An adaptive Design in a French Survey on Professional Careers. In ESRA. Milan.
- Sturgis, Patrick, Jouni Kuha, Nick Baker, Mario Callegaro, Stephen Fisher, Jane Green, Will Jennings, Benjamin E. Lauderdale, and Patten Smith. 2018. “An Assessment of the Causes of the Errors in the 2015 UK Gseneral Election Opinion Polls ” journal of the royal Statistical Society, Series A no. 181 (3):757-787. doi: 10.1111/rssa.12329.
- Tourangeau, R. 2020. “How Errors Cumulate: Two Examples.” Journal of Survey Statistics and Methodology no. 8 (3):413-432. doi: 10.1093/jssam/smz019.
- Tourangeau, Roger, and Ting Yan. 2007. “Sensitive Questions in Surveys.” Psychological bulletin no. 133 (5):859-883. doi: 10.1037/0033-2909.133.5.859.
- World Bank. 2025. Individuals using the Internet. World Bank.
- Zins, M., M. Goldberg, and Constances team. 2015. “The French CONSTANCES population-based cohort: design, inclusion and follow-up.” Eur J Epidemiol no. 30 (12):1317-28. doi: 10.1007/s10654-015-0096-4.
- Zou, Guangyong 2004. “A Modified Poisson Regression Approach to Prospective Studies with Binary Data.” American Journal of Epidemiology no. 159 (7):702-706. doi: 10.1093/aje/kwh090.
-
Keywords
calibration CATI coverage coverage bias cross-national surveys data linkage data quality European Social Survey experiment face-to-face face-to-face survey Facebook hard to reach populations incentives item nonresponse measurement measurement error mixed-mode surveys multitasking non-probability samples Nonresponse nonresponse bias nonresponse rates paradata PIAAC Probability sample probability samples QR codes rare populations response rate Satisficing social desirability Social media survey survey-taking climate survey data survey management survey methods Telephone survey telephone surveys total survey error unit nonresponse validity web survey Web surveys weighting
