Can we understand persons’ postponement in web surveys? Results from communication experiments in the Netherlands.
Janelle van den Heuvel  Statistics Netherlands, The Netherlands
Danielle Groffen Statistics Netherlands, The Netherlands
Michelle Creemers - Statistics Netherlands, The Netherlands
Vivian Meertens Statistics Netherlands, The Netherlands
Maaike Kompier Statistics Netherlands, The Netherlands
van den Heuvel, J., Groffen, D., Creemers, M., Meertens, V. & Kompier, M. (2026). Can we understand persons’ postponement in web surveys? Results from communication experiments in the Netherlands. Survey Methods: Insights from the Field. Retrieved from https://surveyinsights.org/?p=21318.
© the authors 2026. This work is licensed under a Creative Commons Attribution 4.0 International License (CC BY 4.0) 
Abstract
At Statistics Netherlands, we experienced a decline in response rates on social surveys, similar to other National Statistical Institutes (NSIs). In this paper we reflect on the general research question that investigates the effect of different types of procrastination on response behavior within the Dutch Labor Force Survey (LFS). The hypothesis is that procrastinating, not only leads to late-responding but ultimately to non-response due to lack of motivation. The first experiment focused on the position of the call to action in the design of the advance letters, second we tested the effect of mentioning a fictional deadline in the advance letters. The third experiment involved visualizing the login process in the advance letter and sending a formal second reminder. Surprisingly, an ‘earlier mention of the call to action in the advance letter', a more visually engaging login process and a formal second reminder showed an adverse significant effect. A fictional deadline did not show any significant differences. No difference in selectivity between experimental and control groups was found. These findings highlight the complexity of improving response behavior through communication strategies and underscore the need for further refinement in strategies beyond just minor modifications to advance letters.
Keywords
advance letters, CAWI, communication strategy, Labour Force Survey, Procrastination, response rate
Copyright
© the authors 2026. This work is licensed under a Creative Commons Attribution 4.0 International License (CC BY 4.0)
Introduction
A clear trend that affects survey research is the steady, gradual decline in response rates (Luiten, Hox and De Leeuw, 2020). Also, the prospect for future survey response rates is relatively grim and forcing survey designers to tailor and adapt design features using a range of communication channels in order to attract and recruit and maintain respondents. Motivating individuals to respond is one of the most crucial aspects in a time of decreasing response rates. One approach to tackle this problem is by altering the content in communication products such as advance letters and reminders, to stimulate persons to respond. Based on literature reviews, best practices, and numerous experiments, CBS has developed a foundation for its communication products and strategies targeting individuals and households. However, communication is not static, and the ongoing developments in society necessitate continuous optimization.
Starting in 2005, Statistics Netherlands (CBS) has incorporated web data collection (CAWI – computer assisted web interviewing) into its data collection strategy. Since then, a sequential mixed-mode strategy is often used in which respondents are first invited for a web interview, and only non-respondents are subsequently contacted by telephone (CATI – computer assisted telephone interviewing) or face-to-face (CAPI – computer assisted personal interviewing) interviewing. This sequential mixed-mode strategy led to a substantial saving of data collection costs as every response obtained in CAWI no longer required the deployment of the more expensive CATI or CAPI mode ( Schouten et al., 2022). Therefore, increasing CAWI response has been a focal point of many communication experiments at CBS.
In 2019, the Behavioural Intervention Team of the Ministry of Economic Affairs analyzed the CBS communication products that were used in the Labour Force Survey (LFS). Their recommendations were based on the relationship between the degree of procrastination and the response rate. Although procrastination is not typically listed among causes of survey non-response, psychological literature implies an indirect relationship through conscientiousness. Conscientiousness is a strong predictor of survey participation (Dutwin et al., 2025). However, individuals who score low in conscientiousness are more prone to procrastination (Steel, 2007). The hypothesis is that procrastinating, not only leads to late-responding but ultimately to non-response due to lack of motivation and never starting the survey. Less motivated respondents who do ultimately log-in might showcase break-off which could also lead to non-response. A similar phenomenon is seen in panels, where panel dropout is linked to conscientiousness (Lugtig, 2014). Together with observations done by other statistical institutes and psychological literature about procrastination this provided input for three communication experiments.
The general research aim is to target different causes of procrastination. We set up three types of experiments to study whether interventions in the invitation procedure have a positive effect on the response behavior of the whole sample, i.e., higher number of logins at an earlier time-point and lower break-off rates and ultimately a higher response. The objective of this series of experiments is to investigate the effect of 1) the position in the advance letter of the call to action, 2) mentioning a fictional deadline in the advance letters and 3) visualizing the login process and sending a formal second reminder.
Each of these experiments targets a different cause of procrastination. In the first experiment, the effect of the position of the call to action was examined. The call to action aims to initiate an immediate response of the reader. A clear statement on expected behavior should reinforce the intention to act (i.e. Please fill in the survey, immediately after reading this) (Blatt & Quinn, 1967; Skalland et al., 2017). In turn, this would suppress procrastination on the task (Steel, 2007).
Additionally, research shows that the further a task is set in the future, the more likely procrastination will occur (Ferrari, 1993). Tu and Soman suggest that by decreasing the amount of time to the deadline, the reader might be tempted to start the task earlier (Tu & Soman, 2014). A similar experiment has been conducted by Friedel and colleagues, where a higher incentive was offered to early respondents which yielded positive results (2023). Therefore, our second experiment focused on the impact of mentioning a fictional deadline in the advance letter.
The third experiment was about the effect of a visual login process and a formal second reminder. Another cause of procrastination is the ambiguity of the task (Ferrari & Scher, 2000). In an attempt to make the task in the advance letter more accessible and understandable, including visual elements in advance letters are thought to be helpful. Furthermore, they make the task more attractive which is thought to positively influence the intrinsic motivation one feels towards the task (Blunt & Pychyl, 2000). Moreover, visual letters aid persons with lower literacy levels. A study by Skalland et al. showed that the inclusion of web instruction in the advance letter led to a higher web login rate (2017). A formal reminder, like a clear call to action, is expected to enhance intention of the action by asserting authority and reducing ambiguity (Heberlein & Baumgartner, 1978). In combination with the visual login process, this design was expected to suppress procrastination while being suitable for all literacy levels.
Methods
Experimental conditions
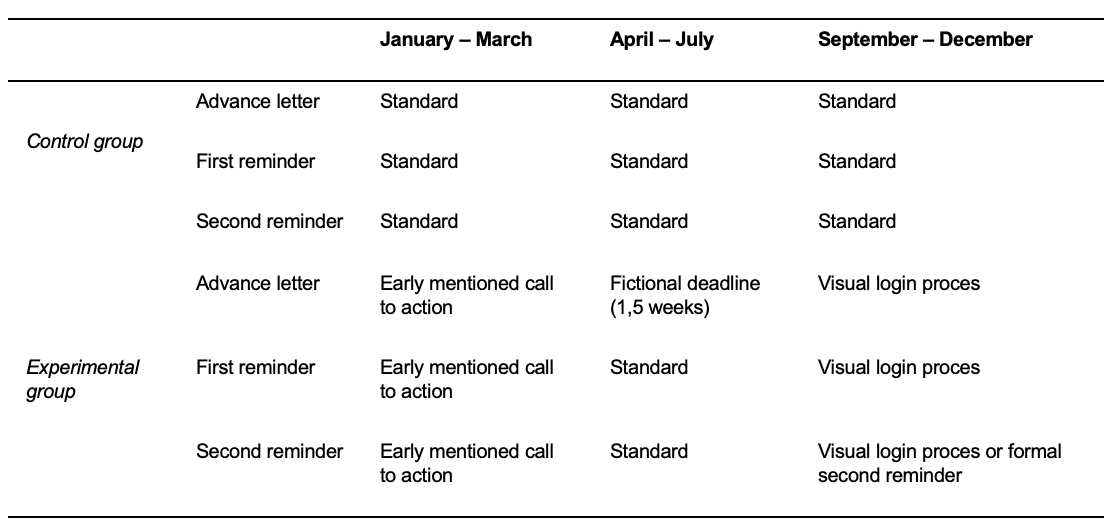
In the first experiment, the effect of the position of the call to action was examined. This was accomplished by moving the introductory paragraph containing information about the study further down in the letter and beginning the letter with the paragraph on ‘How to participate containing the login codes.’. The second experiment focuses on the impact of mentioning a fictional deadline for completion within 1,5 weeks after receiving the advance letter (note that this deadline for completion was not the actual deadline, therefore we call it fictional). The third experiment was about the effect of a visual login process and a formal second reminder. The experimental advance letters alongside the reminder is shown in appendix I.
Labour Force Survey
The three experiments were performed in the Dutch Labour Force Survey (LFS). Based on the mixed mode design of the LFS, statistics about the Dutch labour market like unemployment rates are calculated. The Dutch LFS is a rotating panel survey consisting of five waves conducted at three-month intervals. The target population includes persons aged 15 to 89 years residing in the Netherlands, excluding the institutionalized population. Weekly, a selected sample of persons is invited to participate in the web questionnaire by postal mail. The advance letter includes information about the survey and instructions to access the questionnaire. Non-respondents receive a maximum of two postal reminders. The first reminder is sent two weeks after the advance letter. The second reminder is sent one week after the first reminder. Subsequently, a portion of the non-response group is re-approached in person or by telephone. A more detailed description of the observation method, including subsequent waves, can be found in van Berkel (2022) and on www.CBS.nl. The current analyses are based solely on data collected from LFS web respondents and non-respondents from the first wave The three experiments were fielded sequentially and are schematically presented in table 1.
Table 1. Experimental conditions
Sample
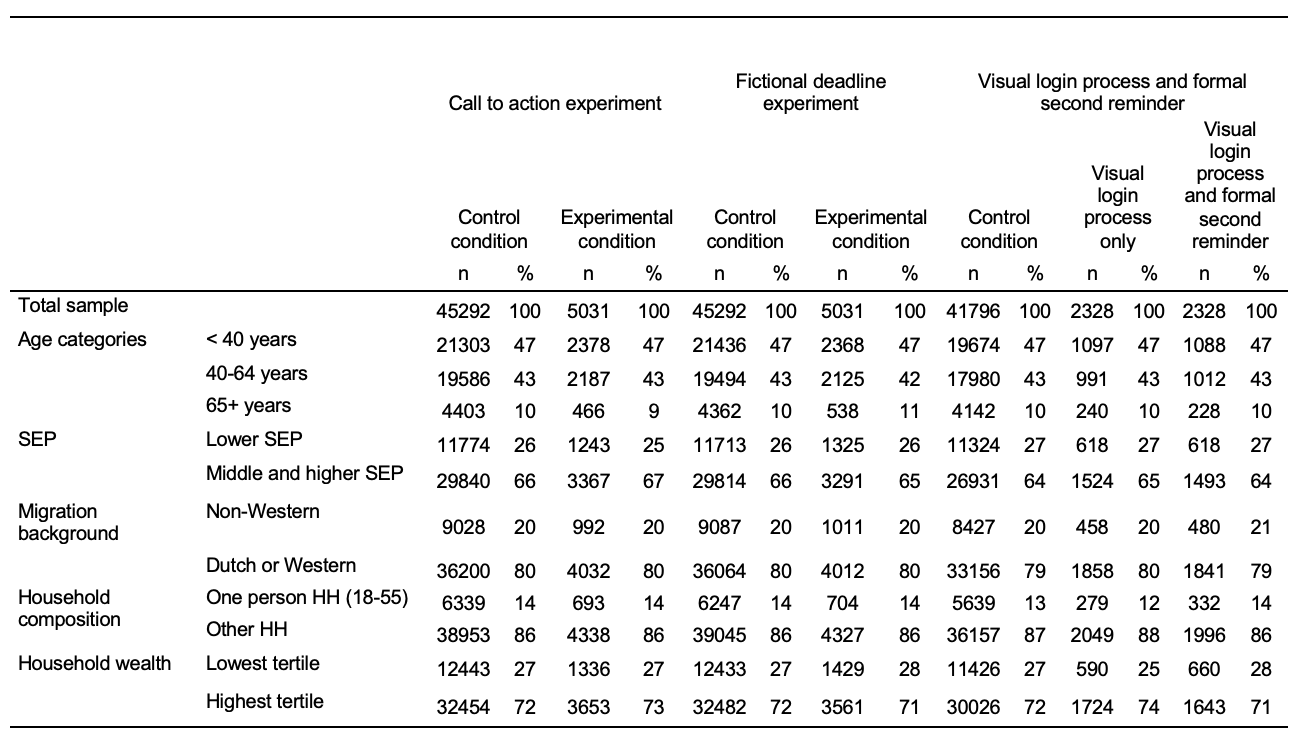
Since the experiment was conducted in the standard data collection of the LFS, we decided to limit the experimental intervention to 10% of the LFS sample, to avoid any potential bias in the response rate and to ensure accuracy to the unemployment rates. In 2023, the weekly LFS sample (i.e. week portions) contained 3871 individuals, of which 378 (10%) received experimental letters and 3484 (90%) received standard advance letters. Groups were assigned randomly to ensure that the most important background variables (i.e. age groups, socioeconomic position, migration background) were evenly distributed across the experimental conditions (See Table 2). Three different gross samples were send out throughout the year. The first gross sample contained the advance letters with an earlier mention of the ‘call to action’ and fielded from January to March, spread over 13 week portions. In this sample, 5031 individuals received the experimental letters and 45,292 individuals received the standard letters. All 50,323 individuals were included in the analyses. The second gross sample contained the advance letters in which a fictional deadline (1,5 weeks after receiving the letter) was mentioned. These were send from April to July, in which 5,031 individuals received the experimental letters and 45,292 individuals received the standard letters where the actual deadline was mentioned only in the second reminder letter. All 50,323 individuals were included in the analyses. The last gross sample was fielded from September to December, in which 5,031 individuals received advance letters with a more visual login process. Half of this group were also sent a more formal second reminder letter in case of non-response after the first reminder. Standard letters were sent to 45,292 individuals. Accidentally, for one of the week portions only the letters for the experimental conditions were sent in time, while the letters for the control groups were sent almost a week too late. Therefore, the elements belonging to this week portion were excluded from the analyses. After exclusion, there were 2,328 elements in the ‘visual login process letter’ group, 2,328 elements in the ‘visual login process + formal 2nd reminder letter’ group and 41,796 elements in the standard letter group.
Table 2. Total gross sample per experiment and background groups
Variables
The analyses focused on the effect of the experimental letters separately for three outcome measures: 1) The percentage of persons starting the questionnaire; 2) The percentage of persons starting the questionnaire but breaking off, and 3) The total response rate. To assess the effect of the ‘visual login process’ letters independently of the effect of the formal second reminder, the response rate until the second reminder was used in this analysis.
The covariates included background variables which are known to influence response behavior. These were age (in years), sex, highest attained educational level (five categories, ranging from elementary education to university level), Social Economic Position (SEP), migration background (Dutch or Western background versus Non-Western background), household composition (one-person households, couples without children, couples with children, single-parent households, other households), household wealth (in percentiles), urbanity (five categories, ranging from very urban to non-urban), and registration at the unemployment agency. Personal income was not included due to high correlations with age, education, and household wealth.
Analyses
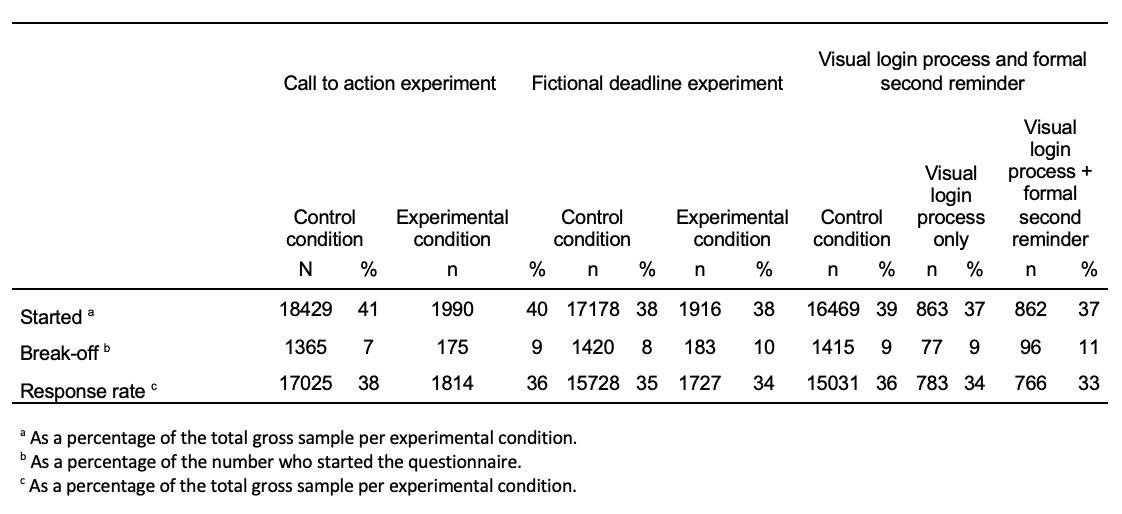
Firstly, descriptive analyses were performed to get an overall view of the distribution of the sample (Table 2), the percentage of persons starting the questionnaire, the percentage of respondents starting the questionnaire of the survey but breaking off and the total response rate for each experimental condition (Table 3). Secondly, for each experimental condition three logistic regression analyses were run, using the experimental conditions and the aforementioned background variables which are known to influence response behavior. The covariates are added simultaneously. To assess the effect of the ‘visual login process’ letters independently of the effect of the formal second reminder, the response rate until the second reminder was calculated. The effect of the formal second reminder could only be validly assessed by using the experimental group who received the visual login process letter as a reference category. To assess the fictional deadline, response up until the deadline was compared to the control. The overall response was compared to the control as well. The odds Ratio’s (OR) and 95% Confidence Intervals (CI) of the models are shown, as well as the Nagelkerke R square (Table 4). Finally, exploratory analyses regarding the selectiveness and composition of the response, using R and CV indicators (Schouten et al., 2009) were performed.
Results
The first descriptive analyses of persons who started, broke off and responded are shown in table 3. The tested comparisons are shown in the full model. The call to action yielded the highest starting rate (40.0%) and response rate (36.0%) among the experimental conditions. The lowest starting rate (37.0%) and response rate (32.9%) was yielded by the visual login process and formal second reminder.
Table 3. Descriptive statistics, persons who started, broke off, and responded to the questionnaire per experimental condition
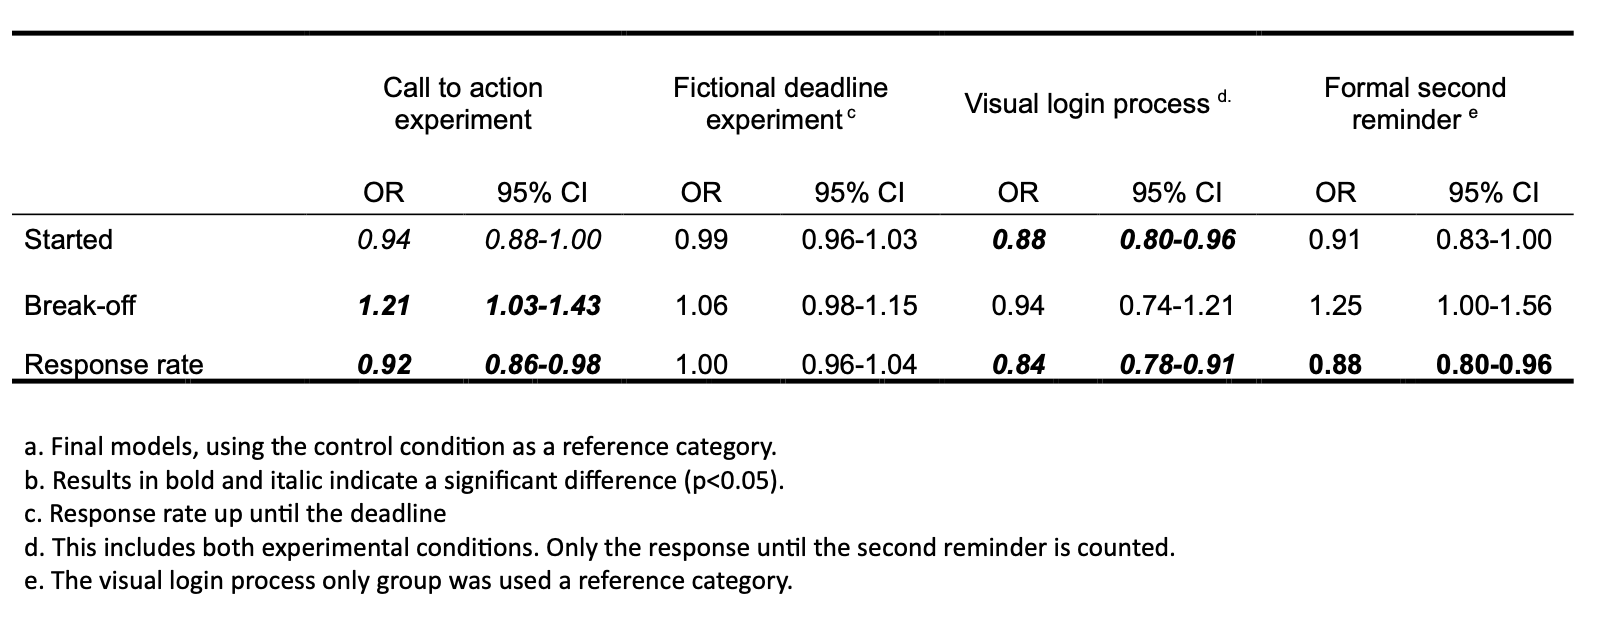
Taking into account important background variables, the logistic regression analysis showed that (Table 4), the advance letter with ‘an earlier mention of the call to action’ resulted in a significantly lower probability of starting the questionnaire (OR = 0.91, CI = 0.85-0.98) compared to the standard letter. Break-off was significantly higher in the experimental condition, as compared to the standard letter (OR = 1.22, CI = 1.01-1.47). Response rates were significantly lower in the experimental condition (OR = 0.89, CI = 0.82-0.95).
For the ‘fictional deadline’ experiment, there were no significant differences in the likelihood of sample units starting the questionnaire, breaking off, or responding between the advance letters including a fictional deadline and the standard letters.
With regard to the visual login process letters (including the formal second reminder group) lower probabilities of starting (OR = 0.88, CI = 0.80-0.96) and completing the questionnaire before the second reminder (OR = 0.84, CI = 0.78-0.91) as compared to standard letters were found.
Finally, a significant lower response rate (OR = 0.88, CI 0.80-0.96) between the formal second reminder and the visual login process only group were found. The full models including the coefficients can be found in appendix II.
Table 4. Logistic regression analyses a,b
Finally, we calculated R and CV indicators (Schouten et al, 2009) to assess the composition of the response in the experimental and control conditions, based on relevant background variables. There were no indications that the selectivity of the response in the experimental conditions was significantly different from the response in the control conditions. These results are shown in table III in the supplementary appendix.
Discussion
Three experiments with variations of advance and reminder letters in the Dutch LFS yielded results that differed from what previous experiments led us to expect. The approach of an early call to action, led to a lower chance of starting and responding to the questionnaire compared to the standard advance letter. Moreover, a fictional deadline showed no significant differences in starting, breaking off, or responding to the questionnaire. Finally, a more visual login process reduced the chances of starting and completing the questionnaire and a formal second reminder did not show a significant difference in response rates.
Advance letters with an earlier mention of the call to action, resulted in a significantly lower probability of persons starting and completing the questionnaire and a higher probability of breaking off compared to the standard letter. These results unexpectedly contradict with Heberlein and Baumgartner (1978) who stated that saliency of the questionnaires positively affected the likelihood to be returned. However, like any other study, results depend on the implementation of the method.
Advance letters including a fictional deadline showed no significant differences in the likelihood of respondents starting the questionnaire and breaking off, or responding as compared to the standard letter. This finding would be in line with a study by Blunt and Pychyl (2000) who showed that the characteristics of the task and task aversiveness can be directly linked to procrastination. Assuming that respondents find the task unpleasant, the deadline would not influence this.
A more visual login process seems to decrease the probability of respondents starting and completing the questionnaire, as compared to the standard letter. A possible explanation is that the design was too visually complex, hereby increasing the perceived task complexity. In turn, this would increase procrastination rather than reducing it. The formal second reminder yielded a negative effect on the response rate in comparison to the visual login process. This would suggest that the task in this letter was formulated even less clear.
Although the sample sizes were too small to formally test interaction terms or conduct separate analyses for each background group, there were indications that the experimental letters had varying effects across different groups. In particular among people younger than 40 years and with a lower socioeconomic position, break-off was higher in the experimental conditions, suggesting that challenges within the questionnaire itself may be contributing to drop-off rates—issues that cannot be addressed solely by modifying the advance letters.
Conclusion and future recommendations
The results of these experiments indicate that persons respond less effectively despite adjustments in the communication strategy. It is recommended to conduct qualitative research within specific groups to gain deeper insights into their motivations, barriers, and perceptions regarding survey participation. These insights could be used to continuously improve or adapt the communication strategies iteratively (qualitative and quantitative) .
CBS is continuously working to enhance the two key components of the participation process. This involves testing substantial changes to the letters, including improvements in both layout and content, as well as incorporating features such as QR codes to facilitate quicker and more convenient access. Additionally, efforts are being made to optimize the questionnaire for smartphone use and the option of offering it in multiple languages. Furthermore, CBS is investigating alternative data collection methods, such as mobile applications, to better align with the habits and preferences of diverse target groups.
Note: The data for this study are stored on the secure environment at Statistics Netherlands. Contact CBS to get access to the data. The scripts are stored on a closed repository. To access the scripts used for this study please contact the authors.
Appendix
References
- Blatt, S. J., & Quinn, P. (1967). Punctual and Procrastination, Self-Consequences of Behavioral Procrastination: The Effects of Academic Procrastination, Self-Consciousness, Self-Esteem and Self-Handicapping. Journal of Social Behavior and Personality, 15, 3-13.
- Blunt, A. K., & Pychyl, T. A. (2000). Task aversiveness and procrastination: A multi-dimensional approach to task aversiveness across stages of personal projects. Personality and Individual Differences, 28(1), 153–167. https://doi.org/10.1016/S0191-8869(99)00091-4
- Dutwin, D., Yan, T., Bilgen, I., & Hendarwan, E. (2025). The Psychological and Personality-Based Underpinnings of Survey Nonresponse. Survey Practice, 18.
- Ferrari, J. R. (1993). Christmas and procrastination: Explaining lack of diligence at a “real-world” task deadline. Personality and Individual Differences, 14(1), 25–33.
- Ferrari, J. R., & Scher, S. J. (2000). Toward an understanding of academic and nonacademic tasks procrastinated by students: The use of daily logs. Psychology in the Schools, 37(4), 359–366.
- Friedel, S., Felderer, B., Krieger, U., Cornesse, C., & Blom, A. G. (2023). The early bird catches the worm! Setting a deadline for online panel recruitment incentives. Social Science Computer Review, 41(2), 370-389.
- Heberlein, T. A., & Baumgartner, R. (1978). Factors affecting response rates to mailed questionnaires: A quantitative analysis of the published literature. American Sociological Review, 43(3), 447–462.
- Lugtig, P. (2014). Panel attrition: Separating stayers, fast attriters, gradual attriters, and lurkers. Sociological Methods & Research, 43(4), 699-723.
- Luiten, A., Hox, J., & De Leeuw, E. (2020). Survey nonresponse trends and fieldwork effort in the 21st century: Results of an international study across countries and surveys. Journal of Official Statistics, 36, 469–487. https://doi.org/10.2478/jos-2020-0025
- Van Berkel, K. (2022). Adaptive survey design for the Dutch Labour Force Survey. American Journal of Theoretical and Applied Statistics, 11(4), 114–121. https://doi.org/10.11648/j.ajtas.20221104.12
- Schouten, B., Cobben, F., & Bethlehem, J. (2009). Indicators for the representativeness of survey response. Survey Methodology, 35, 101–113.
- Schouten, B., Van den Brakel, J., Buelens, B., Giesen, D., Luiten, A., & Meertens, V. (2022). Mixed-mode official surveys: Design and analysis. CRC Press.
- Skalland, B., George, J., Welch, V., Hill, H. A., Elam-Evans, L. D., Knighton, C., & Smith, C. (2017). Testing the Impact of Mail Materials on Web Participation in the National Immunization Survey. In Proceedings of the Survey Research Methods Section, American Statistical Association, Alexandria, VA: American Statistical Association (pp. 3708-3732).
- Steel, P. (2007). The nature of procrastination: A meta-analytic and theoretical review of quintessential self-regulatory failure. Psychological Bulletin, 133(1), 65–94.
- Tu, Y., & Soman, D. (2014). The categorization of time and its impact on task initiation. Journal of Consumer Research, 41(3), 810–822.
-
Keywords
calibration CATI coverage coverage bias cross-national surveys data linkage data quality European Social Survey experiment face-to-face face-to-face survey Facebook hard to reach populations incentives item nonresponse measurement measurement error mixed-mode surveys multitasking non-probability samples Nonresponse nonresponse bias nonresponse rates paradata PIAAC Probability sample probability samples QR codes rare populations response rate Satisficing social desirability Social media survey survey-taking climate survey data survey management survey methods Telephone survey telephone surveys total survey error unit nonresponse validity web survey Web surveys weighting