

Method and transparency of online physician surveys: an overview
Audibert C., Glass D. & Johnson T.P. (2020). Method and transparency of online physician surveys: an overview Survey Methods: Insights from the Field. Retrieved from https://surveyinsights.org/?p=12496
© the authors 2020. This work is licensed under a Creative Commons Attribution 4.0 International License (CC BY 4.0) 
Abstract
Physician surveys are now commonly conducted online, although there is little information currently available regarding the practice of online survey research with health care professionals. We addressed this concern by conducting an overview and assessment of the methodologies disclosed in a sample of 200 published papers that report findings from web-based surveys of physicians. Fifteen methodological aspects of web surveys were coded from each paper, and a transparency index based on aggregation of these various indicators was constructed to evaluate overall survey quality. Some indicators, such as the source and type of samples, along with information regarding ethical aspects of protocols, were commonly reported. In contrast, the use of incentives, and discussion of potential coverage and processing errors were reported less frequently. We hypothesize that these reporting patterns may be dictated by journal requirements. As web surveys are destined to serve as an important modality for data collection from physicians and other health care professionals for the foreseeable future, it is important to encourage – if not require – researchers to regularly disclose a broader range of quality indicators when reporting their research findings.
Keywords
online surveys, physician surveys, survey error, transparency
Acknowledgement
We thank Susan Polanco-Briceno for her help in the preparation of the database and coding of some of the papers.
Copyright
© the authors 2020. This work is licensed under a Creative Commons Attribution 4.0 International License (CC BY 4.0)
Introduction
Physician surveys continue to be an essential strategy for understanding a wide range of current issues in modern health care, including practice patterns, medical ethics, and health care economics, among many other topics (Jacquet et al., 2014; Causo, Gater, & Harnish, 2015; Rapoport et al., 2013; Howard & Borry, 2013; Turini et al., 2015; McBride et al., 2013). Historically, mail questionnaires have been the predominant modality for the collection of survey data from physicians and other busy health care professionals (McLeod et al., 2013; Sudman, 1985; VanGeest, Johnson, & Welch, 2007). In recent years, however, questionnaires administered via the internet have become a serious alternative for the collection of survey data from physicians and the number of web-based physician surveys reported in the professional literature is growing (Cummings, Davitz, & Konrad, 2001; Cunningham et al., 2015; Dykema et al., 2013).
Online surveys offer a number of advantages for both investigators and respondents. They can be fielded more quickly, and less expensively, than traditional mail questionnaires. Many busy physicians may also find them more convenient to complete. Web-based questionnaires can also benefit from many of the measurement advantages associated with computer-assisted data collection, enabling the fielding of complex instruments that facilitate, among other features, automated question skip patterns, range and consistency checks for question responses, and tailored question design (Dykema et al., 2013). Of course, web-based surveys may also have some disadvantages when collecting data from physicians. Coverage is an important challenge, as not all physicians use the internet to the same degree. Nonresponse may also be a challenge, as web-based surveys in general are known to produce lower response rates compared to traditional methods, which suggests they may not be as convenient for physicians as they might otherwise appear to be (McLeod et al., 2013; Cho, Johnson, & VanGeest, 2013).
Nonetheless, both cost considerations and increasing demands for rapid survey data will continue to encourage the development and improvement of this methodology for applications with physicians and other populations of health care professionals. Relative to survey data collection via traditional modalities – mail in particular but also telephone and other approaches – little information is currently available regarding the practice of online physician survey research (McLeod et al., 2013; VanGeest, Johnson, & Welch, 2007; Cho, Johnson, & VanGeest, 2013; Asch, Jedziewski, & Christakis, 1997; Duffett et al., 2012; VanGeest, Beebe, & Johnson, 2015). In this paper, we address this concern by conducting an overview and assessment of the methodologies disclosed in a sample of 200 published papers that report findings from web-based surveys of physicians. In doing so, we will investigate the attention given to five key sources of survey-related error and the degree of transparency found in this literature.
The question of adequate transparency regarding research methods and their limitations has received increased attention in recent years in response to concerns with data quality and general research ethics (Fanelli, 2009; Miller, 2010). The American Association for Public Opinion Research (AAPOR; 2015) Code of Professional Ethics and Practices, for example, suggests that “good professional practice imposes the obligation upon all public opinion and survey researchers to disclose sufficient information about how the research was conducted to allow for independent review and verification of research claims.” The transparency of physician surveys has not been previously evaluated. Having such information would seem to be important, particularly in light of the policy relevance of physician surveys noted earlier.
Sources of Survey Error
It is generally understood that survey error can be classified into five subtypes which are collectively referred to as the elements of the Total Survey Error model. These include sampling, coverage, nonresponse, measurement and processing errors (Groves, 1989). Each of these error sources can independently influence the quality and projectability of survey data. Sampling errors are a consequence of the fact that surveys typically collect data from samples of eligible respondents, rather than the entire population of interest. When samples are randomly drawn, there is a direct relationship between sample size and sample precision, with sampling errors reduced as sample size increases. When non-probability samples are employed, sampling errors cannot be estimated.
Coverage errors can be defined as the failure to include all eligible members of the population of interest in the frame from which respondents are selected. In physician surveys, this may be a consequence of reliance on data collection modalities that systematically exclude otherwise eligible persons. Physicians who have limited or no digital presence, for example, may be more likely to be excluded from a survey conducted solely on the internet, resulting in coverage error to the degree that there are differences in the variables being measured between those who are and are not covered by the sample frame, plus the relative size of the group falling outside the frame.
Nonresponse errors result from demographic, attitudinal and/or behavioral differences between respondents and nonrespondents, along with the total proportion of a given sample that does not respond. By this definition, a response rate alone is inadequate to demonstrate nonresponse error in a survey, although it is often used for this purpose, incorrectly, in the research literature (Johnson & Wislar, 2012). Without knowledge of a survey’s response rate, though, it is not possible to adequately estimate nonresponse error, making it a necessary, if insufficient condition for this purpose. Numerous strategies have been implemented to improve survey response rates and, hopefully, decrease nonresponse error. Some of these that have been employed specifically in the conduct of physician surveys include offering respondent monetary or non-monetary incentives, multiple and personalized contacts with respondents, and sponsorship by respected organizations (VanGeest, Johnson, & Welch, 2007). Although an important component for estimating nonresponse error, previous literature reviews have documented the failure of many published papers to report survey response rates and/or how they were calculated, both in medical and other fields of study (Cummings, Davitz, & Conrad, 2001; Asch, Jedziewski, & Christakis, 1997; Badger & Werrett, 2005; Baruch, 1999; Bennett et al., 2011; Johnson & Owens, 2003; Lee, Benoit-Bryan, & Johnson, 2012; Smith, 2002; von Hermanni & Lemcke, 2017). Literature reviews conducted in other fields have also observed that actual discussion of nonresponse error is only infrequently found (Bennett et al., 2011; Dooley & Kindner, 2003; Werner, Praxedes, & Kim, 2007).
Measurement errors can be a consequence of poor questionnaire design, respondent unwillingness or inability to provide accurate answers, and/or failure of interviewers to properly implement survey protocols. There are several available strategies for minimizing measurement errors. Most common are the conduct of formal pretest or pilot studies, which enable identification of problematic questions and/or field procedures, cognitive interviewing, which is useful for identifying survey questions that are difficult for respondents to understand and/or answer accurately, and standardized survey interviewing protocols, which are designed to minimize interviewer-related errors (Fowler, 1995; Fowler & Mangione, 1989; Willis, 2004). Of course, interviewer-related errors are not a concern in web-based surveys.
Processing errors are also common, often resulting from poor data set construction and/or analysis practices. Examples include failure to properly (or correctly) adjust survey data for differential selection probabilities, using appropriate sampling weights, and failure to recognize and adjust for data dependencies, such as clustering of respondents within medical practices or hospitals. Processing errors may also be the consequence of poor data coding and editing practices that go undetected during initial data set construction. The use of computer-assisted data collection instruments, including online questionnaires, has been demonstrated to improve data quality by reducing processing errors (Dykema et al., 2013; Callegaro, Manfreda, & Vehovar, 2015).
While all surveys are vulnerable to each of these general types of error, there are multiple practical steps that investigators can undertake to minimize the effects of each. Several of these were mentioned earlier. In addition, documentation of these efforts in research reports serves multiple purposes. Doing so provides the information necessary for replication by other researchers. It also serves the interests of research transparency, which is essential for ensuring that adequate information is made available to enable the consumers of research to make independent judgments regarding the quality of the information being reported. Using this framework, we next turn our attention to the published literature that reports findings from web surveys of physicians.
Methods
Search strategy
We performed this overview according to the guidelines of the Preferred Reporting Items for Systematic Review and Meta-Analysis (PRISMA) working group (Moher, Liberati, Tetzlaff, Altman, 2009). We systematically searched the database PubMed for the relevant articles, and the last search was performed on the 2nd of May 2016. We limited our search to PubMed as it was one of the largest databases at the time of the search with an interface with MEDLINE and it was not linked to any publisher. We believe that it produced a sample that is fairly representative of all published papers regardless of the database where they can be found. No restrictions of language or region were applied, although the search terms were in English which de facto excluded articles in other languages. The search terms were “Online survey”, “online questionnaire”, “Web based survey”, “web based questionnaire”, “market research”, “medical chart review”, “online study”, and “web based study”. The search was not supplemented by manual search of the references of the related studies or reviews because we already had identified more papers than could reasonably be analyzed by our research team such that we had to randomly sample from the papers initially identified (see Study selection below). The search period was limited to the years 2013 to 2015. The reasons for this time limit were 1) to limit the number of articles retrieved to a reasonable number that could be analyzed by the research team in the time frame allocated for this project and 2) to review the most recently published papers at the time of extraction to ensure we analyzed the most recent practices in terms of publication of survey data.
Study selection
A total of 6375 articles were retrieved from PubMed for the 2013-2015 time period and using the key words mentioned above. No restriction was applied at that stage. The information collected for each article included PMID, link to the article in PubMed, name of the journal, title, authors, and abstract. Two thousand and ten articles were randomly selected for further data extraction.
Inclusion and exclusion criteria
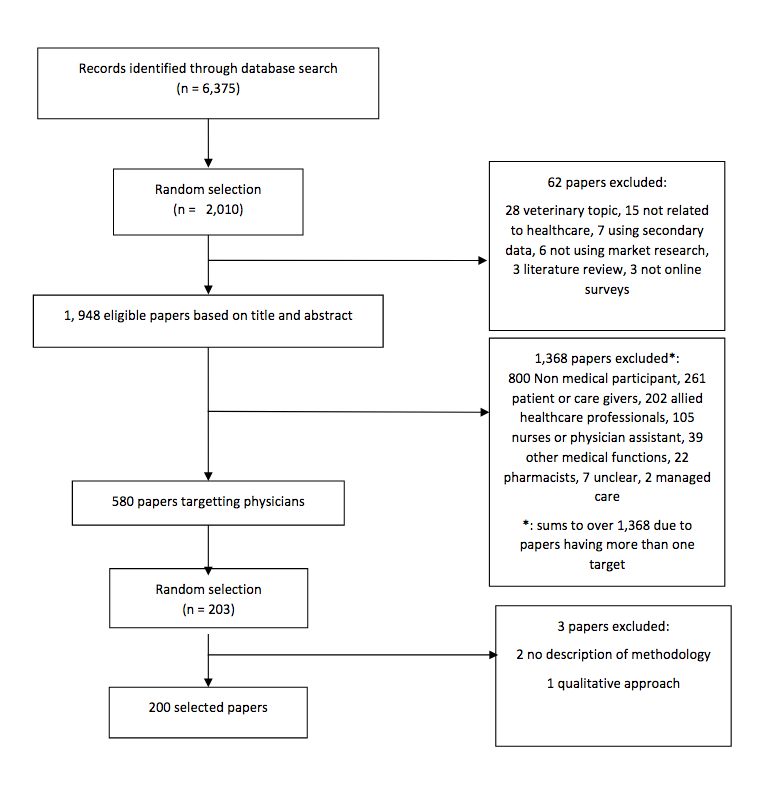
Articles were included if they covered human medical topics and data were collected through online questionnaire. Articles that presented data obtained through both an online questionnaire and a qualitative approach, such as focus groups to help prepare the online survey, were included but the data extraction focused solely on the online survey and excluded the information from the qualitative part. Similarly, papers that targeted both physicians and another type of target such as nurses or patients were included, but we only analyzed the information associated with physicians. Articles that covered any topic other than human medicine were excluded, as well as those who did not use market research or presented secondary data only. Finally, some papers presented information for more than one survey. We therefore separated each survey in our analysis as they could have different characteristics. The article selection process is described in Figure 1.
Fig 1. PRISMA flow diagram of manuscripts identified and evaluated for the analysis
Data extraction
Data extraction was conducted as a two-step approach. First, a high level data extraction was performed on the 2010 selected articles to identify the type of respondent included in the survey: physicians, patients or care givers, nurse practitioners, pharmacists, other (any respondent type that doesn’t fall in the previous categories). This data extraction was based on information present in the title and the abstract. If the type of respondent was missing from this field, we reviewed the full article. 62 papers were excluded because they did not meet the inclusion criteria. This resulted in 1948 eligible articles, out of which 583 identified physicians as respondent type. The second step consisted of the random selection of 203 papers for which physicians were again the type of respondent, and a thorough extraction of the data were performed using a data extraction form in Excel. Three articles were excluded because they did not describe their methodology or no online survey was conducted. Bibliographic details for all 200 papers included in our analysis are provided in Appendix Table 1.
The information collected during the data extraction included the author affiliation (academic versus medical), country where the survey was conducted, mode of recruitment (email, postal mail, phone, internal network or advertisement), whether the survey was piloted, whether IRB approval and respondent consent were obtained, type of conflict interest, if any (industry, academic, journal governmental), type of statistical analysis performed (univariate, bivariate or multivariate), incentives, sample source (panel, list of members of various association or organization, snowball recruitment), sample type (probability, non-probability, census), follow-up contact attempts, and response rate. More specifically for the response rate, we systematically captured the response rate mentioned in the paper, but also re-calculated it using the AAPOR formulas for online research, when there was enough information in the article to allow for this re-calculation (American Association for Public Opinion Research, 2016). Also, several articles included more than one type of physician or presented data from more than one survey. We therefore calculated individual response rates for each group surveyed, which resulted in response rate information for 237 surveys out of the 200 papers.
One researcher systematically reviewed all articles, extracting data for each study for the variables mentioned above. A second researcher independently coded a random sample of 18 articles. To judge coding reliability, Cohen’s kappa was used to examine the consistency between both coders. Findings of this analysis indicate that coefficients for each variable examined were 0.66 or greater. Given that attaining a kappa value of 0.6 or higher is considered a substantial level of mutual agreement, we determined that our coding was reliable (Landis & Koch, 1977).
Variable Coding
Each of the 237 individual surveys was coded as to whether their population universe was broad, medium or narrow. A surveyed group was coded as broad if its universe was large and if it was highly present in the general population, and therefore assumed to be easy to access. Examples of targets coded as broad are oncologists, glaucoma specialists, GPs, nurses. A surveyed group was coded as narrow if its universe was reduced and the target was very specific. Examples of target groups coded as narrow are Program directors for a Canadian anesthesiology residency program (Universe = 17), All teaching assistants in the anatomy-based SAT program over the past five years (Universe = 24) etc. Cut-offs for the universe size were as follows: universe size of 1-399 was coded as narrow unless the specialty is very general such as Primary care specialists, universe size ranging from 400 to 999 was coded as medium, and universe size of 1000 and over was coded as broad. This was done for the 189 surveyed populations for which Universe data was available. For the 48 surveyed groups for which the Universe was not known, coding was based on the type of specialty only.
An ad hoc transparency index, which provides a subjective summary of the degree to which each paper provides information regarding its basic methodology and limitations, was also constructed. This transparency index was based on the following fifteen items: Conduct of pilot test (or an expert review), Recruitment strategies used, Sample source used, Type of sample used, Use of respondent incentives, Use of reminder messages to non-respondents, Conduct of an ethical review, Informed consent was obtained from respondents, Conflict of interest was reported, Response rate(s) or sample disposition(s) were reported, Study response rate(s) were discussed, Potential coverage error was discussed, Potential nonresponse error was discussed, Potential measurement error was discussed, Potential processing error was discussed. The index was constructed as a simple count of the number of these 15 items that were coded as being reported in each paper reviewed. Consequently, the hypothetical range of the transparency index was 0-15. We note that, because so few of the studies examined employed probability sampling, discussion of potential sampling errors were not relevant to most studies. This item was consequently not included in the transparency index.
Results
A majority of the 200 studies reviewed included authors with academic affiliations (85%) and with medical affiliations (73%; Table 1). A much smaller proportion of the studies examined included authors with unknown affiliations (12.0%). In only 2 of the 200 studies reviewed were authors from both non-academic and non-medical settings represented (data not shown). A majority of the studies reviewed indicated whether or not any of the authors had a conflict of interest (80%), and whether or not an ethical review had been obtained prior to conducting the study (76%). Far fewer studies, though, indicated whether or not informed consent was obtained.
| Table 1. General characteristics of papers (n=200) | ||
| Sample distribution | ||
| n | % | |
| Author type* | ||
| Academic | 170 | 85.0 |
| Medical | 146 | 73.0 |
| Other/unknown | 24 | 12.0 |
| Coverage by region | ||
| Asia | 9 | 4.5 |
| Europe | 55 | 27.5 |
| North America | 99 | 49.5 |
| Oceania | 21 | 10.5 |
| Multiple Continents | 16 | 8.0 |
| Ethical review | ||
| Yes | 119 | 59.5 |
| No | 33 | 16.5 |
| Not reported | 48 | 24.0 |
| Informed consent obtained | ||
| Yes | 44 | 22.0 |
| No | 7 | 3.5 |
| Not reported | 149 | 74.5 |
| Conflict of interest | ||
| Reported no conflicts | 136 | 68.0 |
| Reported a conflict | 24 | 12.0 |
| Not reported | 40 | 20.0 |
| Response rate discussed | ||
| Response rate considered low compared to other studies | 83 | 41.5 |
| Response rate considered comparable to other studies | 4 | 2.0 |
| Response rate considered high compared to other studies | 23 | 11.5 |
| Response rate could not be calculated | 2 | 1.0 |
| Response rate not discussed | 88 | 44.0 |
| Statistical analyses presented | ||
| Univariate | 81 | 40.5 |
| Bivariate | 92 | 46.0 |
| Multivariate | 27 | 13.5 |
| Coverage error discussed | ||
| Yes | 49 | 24.5 |
| No | 151 | 75.5 |
| Nonresponse error discussed | ||
| Yes | 109 | 54.5 |
| No | 91 | 45.5 |
| Measurement error discussed | ||
| Yes | 125 | 62.5 |
| No | 75 | 37.5 |
| Processing error discussed | ||
| Yes | 1 | 0.5 |
| No | 199 | 99.5 |
*: sum exceeds 200 as multiple methods were employed for some surveys.
Sampling Error
The information reported regarding the sample design of each of the 237 surveys included in the papers reviewed was next examined. Table 2 provides information regarding the type of sample selection. Just over half (51.9%) of the surveys examined included their entire available sample frame. That is, they conducted a census of the population of interest. Most commonly, these surveys were of the membership of one or more professional medical associations. Other studies were of the physicians employed within a specific health care facility, residents or students enrolled in a specific course or education program, or program director or training staff at a given medical university. Most of the remaining surveys (45.1%) employed non-probability samples. Examples include instances where invitations were sent to a program coordinator who forwarded them to the appropriate target, or the survey was advertised on a variety of media (e-Newsletter, Facebook etc…), or invitations were sent to a sample generated through a web search. Only four (1.7%) of all online surveys examined employed probability sampling. Of course, reporting of sampling error is only relevant for those studies. Of these 4 probability surveys, none provided information regarding the sampling errors associated with the population estimates presented within each published report. Also, the sampling method employed in three of the surveys examined (1.3%) was not reported.
| Table 2. General characteristics of surveys (n=237) reported in 200 papers | ||
| Sample distribution | ||
| n | % | |
| Recruitment strategy* | ||
| 211 | 89.0 | |
| Postal Mail | 12 | 5.1 |
| Internal Network | 13 | 5.5 |
| Social Media Advertisements | 10 | 4.2 |
| Telephone | 4 | 1.7 |
| Not reported | 10 | 4.2 |
| Data collection modalities employed* | ||
| Online questionnaire | 237 | 100.0 |
| Telephone interview | 4 | 1.7 |
| Paper questionnaire | 9 | 1.7 |
| Other modality | 3 | 1.3 |
| Sample source* | ||
| Commercial Panel Provider | 13 | 5.5 |
| Designed Panel | 36 | 15.2 |
| Association Members | 168 | 70.9 |
| eNews Online Ad | 16 | 6.8 |
| Cascade | 37 | 15.6 |
| Other | 5 | 2.1 |
| Not reported | 1 | 0.4 |
| Sample type | ||
| Probability | 4 | 1.7 |
| Non-probability | 107 | 45.1 |
| Census | 123 | 51.9 |
| Not reported | 3 | 1.3 |
| Target population | ||
| Broad | 69 | 29.1 |
| Medium | 52 | 21.9 |
| Narrow | 116 | 48.9 |
| Incentives provided to respondents | ||
| Yes | 38 | 16.0 |
| No | 14 | 5.9 |
| Not reported | 185 | 78.1 |
| Pilot test or expert review conducted | ||
| Yes | 94 | 39.7 |
| No | 5 | 2.1 |
| Not reported | 138 | 58.2 |
| Reminders sent to non-respondents | ||
| Yes | 125 | 52.7 |
| No | 1 | 0.4 |
| Not reported | 111 | 46.8 |
| Response rate or sample dispositions reported | ||
| Yes | 189 | 79.7 |
| No | 48 | 20.3 |
*: sum exceeds 237 as multiple methods were employed for some surveys.
Table 2 also provides information regarding the source of the sample frame(s) employed in each of the 237 surveys examined. Frames based on lists of professional association members were most commonly employed, reported to have been used in 70.9% of the surveys examined. Designed panel frames, such as those created for the purpose of the survey, were used in 15.2% of the surveys. Panels obtained from commercial providers were employed as the sole sample frame source in 5.5 percent of the surveys. Reliance on advertising via eNews online ads (6.8%), and via cascading methods such as asking program directors, heads of departments, trial coordinators to forward the survey to the intended target (15.6%), were other sample sources employed.
Coverage Error
As mentioned earlier, data collection mode(s) can influence the degree to which the population of interest can be adequately covered by the study’s sample frame, and reliance exclusively on web survey questionnaires may exclude otherwise eligible physicians who have limited or no internet access. Although use of the online modality was a requirement for inclusion in this analysis, a small number of the surveys examined did report their use along with other modes, including telephone (1.7%), paper questionnaires (3.8%) and other modalities (1.3%; Table 2). These mixed mode designs have the potential to provide better population coverage and also increase response rates (Beebe et al., 2018).
Several recruitment strategies were reportedly employed to contact and recruit sampled physicians. By far, the use of personal e-mail contacts was the most common method to approaching sampled individuals (89%, Table 2). As Table 2 indicates, other recruitment methods, including postal mail, internal networks, social media advertisements, and telephone, were far less frequently employed reaching sampled individuals (5.1%, 5.5%, 4.2% and 4.2%, respectively). Most surveys used only a single method for recruitment of research subjects (86.5%), and 9.3% employed two or three recruitment methods (4.2% did not specify their recruitment methods; data not shown).
Reliance on e-mails for communicating with sampled respondents is cost effective but can contribute to coverage problems when valid e-mails are unavailable for the complete sample. When sampling from association membership lists, for example, it is not unusual for e-mail addresses to be missing for some members, and for messages sent to some e-mail addresses to not be deliverable (i.e., “bounce-backs”). Our review found discussion of these issues to be very rare in the papers reviewed. In only 6 of the papers examined (3%, data not shown) was information reported regarding numbers of sampled cases for which e-mails “bounced-back” as undeliverable. In no cases was information reported regarding numbers of cases for which e-mail addresses were not available.
About half (48.9%) of the surveys reported examining narrowly defined target populations (Table 2). Broad target populations were the focus of 29.1% of the surveys conducted, and 21.9% examined medium sized target populations.
Another element of coverage concerns the geographic area defined for the survey. Table 1 summarizes geographic coverage for the surveys examined, by continent. Just under half of the sample (49.5%) reported on surveys conducted in the North American countries of Canada, Mexico and the United States. Another quarter of the sample (27.5%) were conducted in European nations, 10.5 percent were conducted in Australia and New Zealand, 4.5 percent were conducted in Asian nations, and 8 percent were conducted across multiple continents.
Potential coverage errors were discussed in one-quarter (24.5%) of the papers reviewed (Table 1).
Nonresponse Error
As mentioned previously, standardized response rates remain an important – if imperfect – metric for understanding the degree to which nonresponse processes may influence the quality of survey data. As shown in Table 1, 189 (79.7%) of the 237 surveys reported information on the response rate or sample disposition. Of these, 163 (68.8%) provided sufficient information to permit comparisons of AAPOR (2016) response rate formula 1 with the response rates reported for these surveys (Table 3). The median reported response rate was 47.0, whereas the AAPOR formula produced a median response rate of 46.7 for the same set of 163 surveys (data not shown). Similarly, the mean reported response rate was 49.1 (SD=23.9) and the mean AAPOR response rate was 48.2 (SD=24.7). Additionally, we compared reported with AAPOR calculated response rates by region where each survey was conducted (Table 3). Although these response rates noticeably varied by region, the differences between reported and AAPOR calculated response rates within regions did not vary significantly across regions.
| Table 3. Response rates specified in observed surveys | ||||
| n | Mean Reported Response Rate (SD) | Mean Calculated AAPOR RR1 (SD) | Difference between Reported and Calculated Response Rates (SD) | |
| Response rate for total sample | 163 | 49.1 (23.9) | 48.2 (24.7) | -1.00 (3.49) |
| Response rates per Region | ||||
| Asia | 11 | 54.3 (26.9) | 54.3 (27.0) | 0.01 (0.11) |
| Europe | 45 | 51.5 (24.5) | 50.5 (25.1) | -1.00 (2.85) |
| North America | 79 | 49.8 (23.3) | 48.8 (24.1) | -1.01 (3.81) |
| Oceania | 16 | 43.4 (18.3) | 41.8 (19.9) | -1.53 (3.81) |
| Multiple Continents | 12 | 38.8 (29.3) | 38.1 (29.7) | -0.67 (1.38) |
| Response rates per Target Population | ||||
| Broad | 41 | 28.4(19.7)a | 25.8 (20.0)a | -2.63 (6.03)a |
| Medium | 30 | 42.4 (19.0)b | 41.4 (19.4)b | -0.78 (1.93)a,b |
| Narrow | 92 | 60.6 (19.8)c | 60.4 (20.0)c | -0.28 (1.65)b |
| Response rates by Manuscript Assessment of Response rate Adequacy | ||||
| Response rate not discussed | 52 | 53.6 (25.1)a | 52.8 (26.1)a | 0.84 (2.62)a |
| Response rate considered low | 83 | 40.4 (20.4)b | 39.4 (20.6)b | 0.97 (2.53)a |
| Response rate considered comparable | 4 | 42.4 (4.1)a,b,c | 33.9 (15.8)a,b,c | 8.50 (16.73)b |
| Response rate considered high | 24 | 70.7 (18.5)c | 70.8 (18.5)c | -0.06 (1.91)a |
| Note: Means with different superscripts differ significantly (p < .05) across population subgroups on the basis of the Bonferroni test. | ||||
Important differences in survey response rates were identified across the types of target populations examined. As depicted in Table 3, broad-based target populations produced the smallest reported and AAPOR response rates (28.4% and 25.8%, respectively), compared to medium or middle-range (42.4% and 41.4%, respectively) and narrow target population groups (60.6% and 60.4%, respectively). Differences in both reported and AAPOR response rates varied significantly across these three groups. In addition, differences between reported and calculated AAPOR response rates were found to be significantly greater for broad target, compared to those for narrow target population studies (-2.63% vs. -0.28%, respectively).
In 56% of the papers reviewed, the adequacy of the response rates achieved were discussed. Approximately three-quarters of these papers (74.1%) acknowledged or expressed concern that the study had a relatively low response rate, while 20.5% claimed to have achieved a relatively high response rate, and 3.6 assessed their response rate as being comparable with other studies. Two of these studies (3.6%) indicated they could not calculate a response rate. Table 3 examines the response rates reported in each paper by these author assessments. Those acknowledging low response rates reported a mean response rate of 40.4%, a value significantly lower than the 70.7% mean response rate reported by authors claiming to have high response rates. Those claiming to have comparable response rates reported a mean value (42.4%) not meaningfully different from that found for papers indicating low response rates. Interestingly, papers that did not discuss their response rates reported a mean rate of 53.6%, which was significantly higher than that reported in papers indicating a low response rate, and significantly lower than what was reported in papers indicating having achieved a high response rate (Table 3). AAPOR response rates closely followed this pattern. One might speculate that authors only felt it was necessary to address response rates that were particularly high or low.
The possibility of nonresponse bias was discussed in more than half of the papers reviewed (54.5%, Table 1). Of these, most (92.7%) specifically discussed potential unit nonresponse error, and a much smaller proportion (11.9%) discussed potential item (or question) nonresponse (4.6% discussed both unit and item nonresponse bias). A small proportion of these studies, 13.8%, also reported conducting some form of nonresponse bias analysis.
Methodological strategies specifically designed to reduce nonresponse bias include making multiple attempts to contact sampled individuals and also offering them incentives to participate. Of the surveys examined, 126 (53.1%) provided information as to whether or not reminders were sent to sampled physicians who had not initially responded (Table 2). A smaller proportion (21.9%, n=52) provided additional information regarding whether or not incentives were offered to respondents. Of these 52, 14 (26.9%) did not provide an incentive. Out of the 38 who provided an incentive, 24 offered to enter a drawing with gifts ranging from cinema tickets to Ipad Mini, 7 offered cash to all respondents, ranging from $25 to $125, 4 offered voucher from a $10 to $50, 1 offered a book, and 2 didn’t specify the type of incentive offered (data not shown).
Measurement Error
Careful pilot testing of survey instruments is a fundamental method for identifying and correcting potential measurement problems in advance of data collection. Our review found that 41.8% of the studies examined reported whether or not a pilot test was conducted in advance of fielding the main survey (Table 2). This included 10.1% of the surveys that reported use of expert reviews of questionnaires to minimize measurement error (data not shown). The extent to which this pilot work led to revisions in instruments or other procedures, however, cannot be discerned as this information was not systematically captured in the manuscripts reviewed.
Measurement error was discussed in just under two-thirds third of the papers examined (62.5%, Table 1). These included a variety of potential concerns, including problems attributable to poor questionnaire design (25.7%), recall or memory problems (24.3%), general problems with self-reports (24.3%), social desirability concerns, including over- and under-reporting (14.9%), respondent difficulty with question interpretation or language (10.8%), and the mode of data collection (2.7%).
Processing Error
Processing errors include problematic data entry, errors in recoding and construction of analytic variables, errors in the conduct of statistical analysis, including failure to correctly adjust sample weights and/or variance estimates for complex probability sample designs. Of the 200 studies reviewed, 40.5 percent reported descriptive, univariate statistical analyses only (Table 1). A plurality (46%) reported bivariate analyses, primarily cross-tabulations and/or ANOVA comparisons across groups, and 13.5 percent reported multivariate analyses, typically regression models. Only one (0.5%) of the papers examined explicitly acknowledged the possibility of processing error in relation to their research (Table 1).
Transparency Index
The 15 items employed to construct the transparency index are presented in Appendix Table 2 in descending order based on the proportion of the 200 papers reviewed in which each was included. Of these items, an average of 8.8 and a median of 9 were disclosed. In other words, these papers provided on average more than half of the methodological details examined (58.7%). The most reported in any paper were 13 of the 15 items (86.7%, data not shown). Of the ten items reported in more than half of the studies examined, seven were concerned with aspects of sampling, recruitment and nonresponse error. Two other commonly reported items were concerned with research ethics: the reporting of conflicts of interest and review by ethics committees. Less commonly reported details associated with coverage, measurement and processing errors.
Additional analyses examined transparency index scores by types of paper authorship and region(s) of the world where each study was conducted. Breakdowns by author type can be found in Appendix Table 3. Overall, there was little variation across papers that included academic, medical, and/or other types of authors. Each of these three groups of papers were found to have identical median values on the transparency index (9.0). Similarly, when comparing indices by regions where each study was conducted, the median transparency index values, with one exception, were again all found to be 9.0 (Appendix Table 4). This suggests there are few differences in the level of transparency being disclosed by various types of authors reporting findings from online surveys of clinicians being conducted around the world.
Discussion
The use of the internet for conducting surveys of physicians and other clinicians is a relatively new innovation, albeit an important one, as web-based surveys are growing in popularity and may well become the dominant survey modality in the near future if not already. It is recognition of this growing trend to use the internet for gathering information from health care professionals that motivated this study. Our findings suggest that researchers employing the internet to survey physicians routinely report multiple elements of their research methods. The median number of elements reported, in fact, was 9 of the 15 examined. Other elements often go unreported, though, and these are each important for documenting and evaluating research quality. We discuss each of these elements below from the perspective of the Total Survey Error framework, which we employed in evaluating the research transparency of recent online surveys of physicians.
Regarding aspects of the samples employed in online physician surveys, virtually all of the publications reviewed (99.5%) indicated the source of their sample(s). Most (98%) also provided sufficient information for the reader to discern the type of sample being used (e.g., probability, non-probability, census). Clearly, investigators – and editors – recognize the importance of providing a basic description of sample designs. One concern with the reporting of this information was the reliance in some studies on samples drawn from online panels, some of which provide little documentation regarding how those sample frames were originally constructed. This problem is seldom recognized or acknowledged. Of additional note is the finding that few of these online surveys (2%) employed random sampling. Rather, a majority (70.9%) relied on membership list frames and in most cases invited the entire list to participate. Of the very small number of surveys employing random sampling, none reported the use of sample weights or other adjustments for sample design, suggesting a greater interest in internal rather than external validity. In general, though, basic sampling information was disclosed on a regular basis in most publications reviewed.
Sample coverage is an equally important issue that is often unaddressed and which can have important implications for a survey’s ability to generalize to the population of interest. Of most obvious concern is the exclusion of otherwise eligible individuals who do not routinely access the internet. Nonworking or outdated e-mail addresses (by far the most common method of inviting physicians to participate in web surveys) are an additional concern. We found little evidence that these threats to sample coverage are being considered in the research literature – only one-quarter of the papers reviewed here (24.5%) discussed potential coverage errors – and strongly recommend that researchers begin disclosing this information and that journal editors require it. One potential solution to coverage error concerns is the use of mixed-mode survey strategies. For example, following up an e-mail invitation to participate in a web survey with a paper mail questionnaire or telephone interview would address some of the potential coverage limitations associated with online surveys, and would almost certainly lead to increased response rates. Another strategy is use of multiple methods for inviting sampled persons to participate in the survey. Our analyses revealed, unfortunately, that most studies (86.5%) relied on a single invitation method.
Response rates remain the most commonly recognized single indicator of survey quality, and response rates to physician surveys have declined over the past several decades (Biemer & Lyberg, 2003; Cook, Dickinson, & Eccles, 2009; Cull et al., 2005). Ironically, web surveys are known to produce lower response rates compared to other more traditional data collection modalities (Fan & Yan, 2010). Historically, many published papers have failed to report survey response rates and/or how they were calculated, both in medical and other fields of study (Cummings, Davitz & Konrad, 2001; Asch, Jedziewski & Christakis, 1997; Badger & Werrett, 2005; Baruch, 1999; Bennett et al., 2011; Johnson & Owens, 2003; Lee, Benoit-Bryan & Johnson, 2012; Smith, 2002; von Hermanni & Lemcke, 2017). In contrast, our study found approximately four-in-five papers (83.5%) did report either response rates or the disposition information needed to calculate them. More than half of all studies (56%) additionally discussed and evaluated their response rates. In comparing reported response rates to those estimated using AAPOR standards, we found considerable consistency, with an average difference suggesting that reported response rates were 1.0 percentage points higher than those obtained using the more conservative AAPOR formulas. The reported response rates also followed a predictable pattern in that samples from broad-based target populations tended to produce lower response rates compared to those from medium and more narrowly-based target groups. In general, more narrowly-based sample frames tended to represent more local and specialized populations for whom survey topics might be more salient and the group conducting the survey more recognizable. One might expect each of these factors to be associated with higher response rates. Other factors known to be associated with increased survey response include use of follow-up reminders with initial nonrespondents and the use of respondent incentives. While the use (or not) of follow-up reminder messages was reported in more than half (55.5%) of the papers reviewed, the use (or not) or respondent incentives was indicated in only one-in-five (20.5%) studies. Clearly, the availability of this information is necessary when evaluating adequacy of response rates.
As discussed earlier, response rates remain an imperfect measure of nonresponse error. Just over half of all papers (54.5%) acknowledged this fact by specifically discussing the threat of nonresponse error in their research, and of these, 13.8% reported conducting some form of actual nonresponse bias analysis. This percentage represents 7.5% of our complete sample, which is somewhat less than the 18% and 17% of papers conducting nonresponse bias analyses in reviews conducted by Cummings et al. (2001) and Cook et al. (2009), respectively, of mail surveys of physicians. While researchers clearly recognize the importance of reporting response rates in online physician surveys, it seems also important to encourage the routine discussion of potential nonresponse errors and the use of available methods for their detection (Johnson & Wislar, 2012).
Measurement errors are acknowledged and discussed by some researchers while others seem to ignore this potential challenge. We found that roughly two-thirds of the studies reviewed (62.5%) included a consideration of potential measurement errors, which can take many forms. In web surveys, these can range from poorly constructed or unclear survey questions, to a focus on highly personal information, to requests for information that requires precise recollections from memory. One of the most valuable tools for minimizing measurement error is instrument pretesting, a topic discussed in less than half (41.5%) of the papers examined. Testing questionnaires prior to data collection is a minimal requirement for the conduct of quality survey research, and one that a majority of the papers we examined neglected to consider.
The electronic nature of web surveys, with opportunities for multiple forms of quality control checks, can be expected to contribute to fewer processing errors than more traditional forms of self-administered (i.e., mail) physician surveys. This approach, though, would appear to have no advantage in terms of other forms of processing error, including weighting and other adjustments for sample design. Yet, the relative infrequency of random sampling would seem to render these other types of processing errors less of a concern. It is nonetheless remarkable that only one of the 200 studies reviewed explicitly considered the possibility of processing errors.
Several aspects of survey methodology involving the ethical conduct of research were also included in this review. We found that more than three-quarters of the papers examined reported the presence (or not) of conflicts of interest (80%) and ethical review oversight (76%). While the reporting of this information is to be applauded, we note that commenting on institutional review board (IRB) reviews and potential conflicts of interest is often an editorial requirement that authors are expected to conform with as a condition for publication. This could account for the relatively high percentage of papers reporting this information. If so, we commend the journals and their editors for their commitment to ethical transparency. Only one-quarter of these studies (25.5%), however, reported whether or not informed consent had been obtained from respondents. We encourage editors to also require this information be provided by authors.
We acknowledge several limitations. Most importantly, our literature overview is based on research papers identified in one bibliographic database (PubMed) only. Although we believed that this database would enable us to access most of the English language medical literature where physician survey findings would be reported, this may nonetheless have limited the relevant journals that were included in our search. In addition, the disclosure elements reviewed in this study are somewhat arbitrary, although we did examine multiple variables associated with each aspect of the Total Survey Error model. As it is based on this set of indicators, the transparency index we constructed is also somewhat arbitrary. We nonetheless believe it provides a useful and innovative rubric for examining the degree to which researchers disclose and critically assess generally understood dimensions of their research methods.
In conclusion, we have learned that investigations that report on web-based surveys of physicians are fairly reliable in reporting their sample designs and response rates, along with information regarding ethical aspects of their protocols. Disclosure of this information on a regular basis is likely a consequence of journal requirements. We additionally suspect that less frequent discussion and/or consideration of potential survey coverage, measurement and processing errors are a consequence of less emphasis being placed on these concerns by journal reviewers and editors. As web surveys appear destined to serve as an important modality for data collection from physicians and other health care professionals for the foreseeable future, it is important to encourage – if not require – researchers to regularly disclose a broader range of quality indicators when reporting their research findings.
Appendix Tables
References
- American Association for Public Opinion Research (2015). Code of Professional Ethics and Practices. Available from: https://www.aapor.org/Standards-Ethics/AAPOR-Code-of-Ethics/AAPOR_Code_Accepted_Version_11302015.aspx
- American Association for Public Opinion Research (2016). Standard Definitions: Final Dispositions of Case Codes and Outcome Rates for Surveys, 9th Edition. Available from: https://www.aapor.org/AAPOR_Main/media/publications/Standard-Definitions20169theditionfinal.pdf
- Asch DA, Jedziewski MK, Christakis NA. (1997). Response rates to mail surveys published in medical journals. Journal of Clinical Epidemiology, 50(10), 1129-1136.
- Badger F, Werrett J. (2005). Room for improvement? Reporting response rates and recruitment in nursing research in the past decade. Journal of Advanced Nursing, 51(5), 502-510.
- Baruch Y. (1999). Response rate in academic studies—A comparative analysis. Human Relations, 52(4), 421-438.
- Beebe TJ, Jacobson RM, Jenkins SM, Lackore KA, Rutten L.F. (2018). Testing the impact of mixed-mode designs (mail and web) and multiple contact attempts within mode (Mail or web) on clinician survey response. Health Services Research, 53(4), Part II, 3070-3083.
- Bennett, C, Khangura S, Brehaut JC, et al. (2011). Reporting guidelines for survey research: An analysis of published guidance and reporting practices. PLoS Medicine, 8(8), e1001069.
- Biemer PP, Lyberg LE. (2003). Introduction to Survey Quality. New York: Wiley.
- Callegaro M, Manfreda KL, Vehovar V. (2015). Web Survey Methodology. Los Angeles: Sage.
- Caruso D, Gater D, Harnish C. (2015). Prevention of recurrent autonomic dysreflexia: a survey of current practice. Clinical Autonomic Research, 25(5), 293-300.
- Cho YI, Johnson TP, VanGeest JB. (2013). Enhancing surveys of health care professionals: A meta-analysis of techniques to improve response. Evaluation & the Health Professions, 36(3), 382-407.
- Cook JV, Dickinson HO, Eccles MP. (2009). Response rates in postal surveys of healthcare professionals between 1996 and 2005: An observational study. Health Services Research, 9, 160.
- Cull WL. O’Connoer KG, Sharp S, Tang SS. (2005). Response rates and response bias for 50 surveys of pediatricians. Health Services Research, 40(1), 213-226.
- Cummings SM, Davitz LA, Konrad TR. (2001). Reported response rates to mailed physician questionnaires. Health Services Research, 35(6), 1347-1355.
- Cunningham CT, Quan H, Hemmelgarn B, et al. (2015). Exploring physician specialist response rates to web-based surveys. BMC Medical Research Methodology, 15, 32.
- Dooley LM, Lindner JR. (2003). The handling of nonresponse error. Human Resource Development Quarterly, 14(1), 99-110.
- Duffett M, Burns KE, Adhikari NK, et al. (2012). Quality of reporting of surveys in critical care journals: A methodologic review. Critical Care Medicine, 40(2), 441-449.
- Dykema J, Jones NR, Piché T, Stevenson J. (2013). Surveying clinicians by web: Current issues in design and administration. Evaluation & the Health Professions, 36(3), 352-381.
- Fan W, Yan Z. (2010). Factors affecting response rates of the web survey: A systematic review. Computers in Human Behavior, 26, 132-139.
- Fanelli, D. (2009). How many scientists fabricate and falsify research? A systematic review and meta-analysis of survey data. PLoS ONE, 4(5), e5738.
- Fowler FJ. (1995). Improving Survey Questions: Design and Evaluation. Thousand Oaks, CA: Sage.
- Fowler FJ, Mangione TW. (1989). Standardized Survey Interviewing: Minimizing Interviewer-Related Error. Thousand Oaks, CA: Sage.
- Groves RM. (1989). Survey Errors and Survey Costs. New York: Wiley.
- Howard HC, Borry P. (2013). Survey of European clinical geneticists on awareness, experiences and attitudes towards direct-to-consumer genetic testing. Genome Medicine, 5(5), 45.
- Jacquet GA, Hansoti B, Levine AC, Martin IB. (2014). Career paths and practice patterns of global emergency medicine physicians: a cross-sectional survey. Journal of Emergency Medicine, 47(3), 348-354.
- Johnson TP, Wislar JS. (2012). Response rates and nonresponse errors in surveys. JAMA, 2307(17), 1805-1806.
- Johnson T, Owens L. (2013). Survey response rate reporting in the professional literature. Proceedings of the Survey Research Methods Section, American Statistical Association. Available from: http://www.srl.uic.edu/publist/Conference/rr_reporting.pdf.
- Landis JR, Koch GG. (1977). The measurement of observer agreement for categorical data. Biometrics, 33(1), 159-174.
- Lee G, Benoit-Bryan J, Johnson TP. (2012). Survey research in public administration: Assessing mainstream journals with a total survey error framework. PAR, 72(1), 87-97.
- McBride A, Holle LM, Westendorf C, et al. (2013). National survey on the effect of oncology drug shortages on cancer care. American Journal of Health System-Pharmacy, 70(7), 609-617.
- McLeod CC, Klabunde CN, Willis GB, Stark D. (2013). Health care provider surveys in the United States, 2000-2010: A review. Evaluation & the Health Professions, 36(1), 106-126.
- Miller, P.V. (2010). The road to transparency in survey research. Public Opinion Quarterly, 74, 602-606.
- Moher D, Liberati A, Tetzlaff J, Altman DG. (2009). Preferred reporting items for systematic reviews and meta-analyses: The PRISMA statement. PLoS Medicine, 6(7), e1000097.
- Rapoport A, Obwanga C, Sirianni G, Librach SL, Husain A. (2013). Not just little adults: palliative care physician attitudes toward pediatric patients. J Palliative Medicine, 16(6), 675-679.
- Smith TW. (2002). Reporting survey nonresponse in academic journals. International Journal of Public Opinion Research, 14(4), 469-474.
- Sudman S. (1985). Mail surveys of reluctant professionals. Evaluation Review, 9(3), 349-360
- Turini M, Piovesana V, Ruffo P, Ripellino C, Cataldo N. (2015). An assessment of chemotherapy-induced nausea and vomiting direct costs in three EU countries. Drugs in Context, 4, 212285.
- Van Geest JB, Beebe TJ, Johnson TP. (2015). Surveys of physicians. In: Johnson TP, ed. Handbook of Health Survey Methods. Hoboken, NJ: Wiley, pp. 515-560
- VanGeest JB, Johnson TP, Welch VL. (2007). Methodologies for improving response rates in surveys of physicians: A systematic review. Evaluation & the Health Professions, 30(4), 303-321.
- von Hermanni H, Lemcke J. (2017). A review of reporting standards in academic journals – A research note. Survey Methods: Insights from the Field. Available from: https://surveyinsights.org/?p=8625.
- Werner S, Praxedes M, Kim H.-G. (2007). The reporting of nonresponse analyses in survey research. Organizational Research Methods, 10(2), 287-295.
- Willis GB. (2004). Cognitive Interviewing: A Tool for Improving Questionnaire Design. Thousand Oaks, CA.
-
Keywords
calibration CATI coverage coverage bias cross-national surveys data linkage data quality European Social Survey experiment face-to-face face-to-face survey Facebook hard to reach populations incentives item nonresponse measurement measurement error mixed-mode surveys multitasking non-probability samples Nonresponse nonresponse bias nonresponse rates paradata PIAAC Probability sample probability samples QR codes rare populations response rate Satisficing social desirability Social media survey survey-taking climate survey data survey management survey methods Telephone survey telephone surveys total survey error unit nonresponse validity web survey Web surveys weighting
