

The Effect of Quick Response (QR) Codes on Response Rates and Respondent Composition: Results from a Statewide Experiment
Endres K., Heiden E.O. & Park K. The Effect of Quick Response (QR) Codes on Response Rates and Respondent Composition: Results from a Statewide Experiment. Survey Methods: Insights From the Field. Retrieved from https://surveyinsights.org/?p=19389
© the authors 2024. This work is licensed under a Creative Commons Attribution 4.0 International License (CC BY 4.0) 
Abstract
We conducted a randomized experiment that evaluated how the inclusion of a Quick Response (QR) code in mailed survey recruitment materials for a sequential mixed-mode (push to web followed by self-administered mail back) survey fielded with a statewide probability address-based sample impacted survey participation. Each address was randomly assigned to receive mailed recruitment materials with either a unique uniform resource locator (URL) only or a unique URL with a QR code. The inclusion of a QR code resulted in a small (+1.31 percentage point) increase in overall participation and a small (+1.01 percentage point) increase in the share of recipients who completed the questionnaire on the web. The QR code also proved beneficial for recruiting respondents from some hard-to-reach segments of the state population compared to the URL only condition. Specifically, the percentage of younger participants aged 24 to 34 was 6 percentage points higher, lower income groups with an annual household income from $35,000 to less than $50,000 was 7 percentage points higher, and single participants who have never been married was 11 percentage points higher in the QR code+URL condition compared to the URL only condition.
Keywords
experiment, hard to reach populations, QR codes, Representativeness, survey response rates
Copyright
© the authors 2024. This work is licensed under a Creative Commons Attribution 4.0 International License (CC BY 4.0)
Introduction
Initial assessments of incorporating Quick Response (QR) codes into mail survey recruitment materials concluded that the costs of QR codes likely exceed the benefits due to the expense associated with generating large numbers of unique QR codes and insignificant effects on both response rates and facilitating participation from hard-to-reach segments of the population (e.g., Allen et al. 2016, Marlar 2018). However, QR codes have experienced a resurgence over the past few years in the United States as Americans have become more accustomed to using QR codes (Gostin 2021). Further, QR codes have become easier for everyday Americans to use since QR code readers are now standard smartphone features with both Android (Anotonelli 2022) and iPhones (Apple 2021) allowing users to access QR codes using their phone’s built-in camera. In addition to the use of QR codes becoming more widespread in recent years, cost concerns are also no longer a factor as thousands of unique QR codes can be generated in Microsoft Office when creating personalized letters using a mail merge (Dimech 2018). The changing cost structure and the newfound prevalence of QR codes raises the question as to whether or not QR codes can be successfully implemented into mailed survey recruitment materials to increase response rates. Specifically, this study seeks to answer two research questions: Does including a QR code in mailed survey recruitment materials improve the response rate for a sequential mixed-mode (push to web “PTW” followed by self-administered mail back “SAM”) survey? And, does including a QR code increase the proportion of respondents from traditionally less participatory groups (e.g., less formal education, lower income, and younger respondents)?
The prospect that QR codes might improve response rates and participation among hard-to-reach segments of the population warrants additional investigation now that QR codes have expanded in use among the American public and can be implemented without impacting a project’s budget. Any feature that can be incorporated into survey recruitment materials at little or no costs while facilitating participation even modestly either overall or among key demographic groups that generally participate at lower rates is important to consider. Further, small gains in participation have the potential to translate into larger gains when compounded with other design innovations that similarly incrementally improve participation.
To assess the effects of including QR codes in mailed survey recruitment materials on response rates and the composition of survey participants, we fielded a sequential mixed-mode survey with a statewide probability address-based sample (ABS). Each address was randomly assigned to receive mailed recruitment materials (PTW letter followed by a SAM packet) with either a unique uniform resource locator (URL) only or a unique URL with a QR code. As a preview, we found that the inclusion of a QR code had a modest, positive 1.31 percentage point increase on the overall response rate. The QR code also increased the percentage of letter recipients who completed the questionnaire on the web, which further reduced costs associated with both the return postage needed to mail back the completed SAM booklet and processing and inputting the data from the SAM booklet. The QR code also significantly increased the proportion of respondents from some hard-to-reach groups compared to the URL only condition, including younger participants (ages 25 to 34), some lower income groups (annual household income $35,000 to less than $50,000), and single participants who have never been married. In the following sections, we provide an overview of previous QR code studies, present our hypotheses, describe the study and experimental design, detail the findings from the experiment, and discuss implications for future data collection efforts.
Background & Expectations
QR codes can be included alongside URLs in mailed survey recruitment materials to push letter recipients to the web so that they may complete an online questionnaire (Dillman et al. 2014). Previous QR code experiments that were conducted prior to the expanded use of QR codes and the incorporation of native QR code readers on most smartphones recognized the potential for QR codes to facilitate survey participation but concluded that the costs associated with implementation that were present at that time (2015) likely exceeded the benefits (Marlar 2018). QR codes have since gained traction in the United States, partly due to their expanded use during the early months of the COVID-19 pandemic (Gostin 2021) and the dwindling costs associated with the generation of thousands of unique QR codes (Dimech 2018).
More recent studies have considered the effects of QR codes on overall response rates with more niche sample frames than a statewide probability ABS. For example, Endres and colleagues (2023) found that QR codes resulted in a small, but statistically significant increase in overall participation on a dual-frame random digit dial (DF-RDD) sample with appended residential addresses who were invited to participate in a sequential mixed-mode (PTW and CATI/phone) survey. Another study in Chicago compared participation in the study’s 2022 survey that included QR codes in outreach materials to the previous two data collection years that did not include a QR code, and found improvements in participation among some demographic groups (e.g. African Americans and Hispanics) when the QR code was included (Lee et al. 2023). While both of these studies found QR codes to be beneficial, another recent study in the Netherlands found that incorporating a QR code into mail outreach materials did not increase participation (Lugtig and Luiten 2021). Though, the inclusion of the QR code did increase the share of respondents who used a smartphone to complete the questionnaire (Lugtig and Luiten 2021), a finding that was confirmed in the U.S. based experiment (Endres et al. 2023).
QR codes have the potential to improve survey participation by making web surveys easier to access, as recipients of the survey recruitment materials may simply use their smartphone to scan the QR code, which would take them directly to the online questionnaire. In fact, usability testing with older and less technologically sophisticated adults revealed a preference for QR codes over typing in the URL, which reduces the possibility of errors such as mistakenly inputting the wrong URL (Rivas and Schulzetenberg 2023). QR codes may also be especially useful for segments of the population who primarily rely upon their smartphones to access the internet outside of work or school. Americans with lower levels of education and lower incomes disproportionately comprise the segment of the population without high-speed home broadband (Perrin 2021, Pew Research Center 2021). A recent statewide survey (in the state of the present study) focused on digital equity confirmed these findings with just over half of households with an income below $50,000 reporting they have higher-speed broadband internet at home compared to more than three-fourths of households with incomes over $50,000 (Endres et al. 2023). Relatedly, smartphones were much more common (94%) than home desktops (50%) or home laptops (78%) with smartphones being almost universal among state residents under 55 years old (Endres et al. 2023).
Differences in access to quality home internet and the devices used to access the internet highlight elements of leverage-salience theory which suggests different survey design features may influence the decision making of some groups more than others (Groves et al. 2000). Based on both leverage salience theory and the segments of the population with more limited access to higher-speed broadband internet, QR codes might be particularly effective at improving participation among these lower income, lower education, and younger segments of the population. For similar reasons, QR codes may boost participation among some racial/ethnic groups as observed when the Chicago survey added QR codes to outreach materials (Lee et al. 2023). In addition, the inclusion of a QR code may alter perceptions of the perceived time and burden associated with survey participation by making it easier for at least some groups to access the online questionnaire, which might encourage selected individuals to complete the web survey if they in fact perceive participation as less burdensome (Dillman et al. 2014). The presence of a QR code may also suggest to letter recipients that the survey is relatively short, and as such may further motivate their participation (Lugtig and Luiten 2021).
Based on the previous studies and theoretical considerations discussed above, we set four hypotheses. The first considers the overall response rate while the remaining three consider participation among respondents with lower levels of formal education, lower household incomes, and younger respondents. Specifically, we hypothesized: (1) the response rate for the survey would be higher among the addresses randomly assigned to receive mail invitations with a QR code. (2) The QR code condition would produce a higher proportion of respondents without a 4-year college degree (categories: no college and some college) than the URL only condition. (3) The inclusion of a QR code would produce a higher proportion of respondents from the low-income categories (annual household income below $25,000, $25,000 to less than $35,000, and $35,000 to less than $50,000). (4) The QR code condition would produce a higher proportion of younger respondents (under 35 years old, 18-24, and 25-34).
Experimental Design & Methods
We tested the effects of including QR codes in mailed survey recruitment materials during data collection for a statewide sequential mixed-mode (PTW followed by SAM) survey focused on science, technology, engineering, and mathematics (STEM) careers and education. We obtained 5,500 residential addresses that were sampled from the USPS computerized delivery sequence file. Each address was randomly assigned to either a QR code+URL condition or a URL only condition. Due to our strong expectation that response rates would be higher if the mailed recruitment materials included a QR code, approximately two-thirds of the addresses were assigned to the QR code+URL condition (n=3,679) and one-third to the URL only condition (n=1,821). Addresses in the QR code+URL condition were mailed recruitment materials with a unique QR code and a URL, while addresses assigned to the URL only condition were mailed recruitment materials with a unique URL only. Each URL and QR code (if provided) directed the letter recipient to the online questionnaire. The unique URLs/QR codes allowed recipients to begin the questionnaire without entering an access code or pin number.
The survey took about ten minutes to complete, and there were no incentives offered to encourage participation. PTW invitations were mailed on November 15, 2022 in a standard #10 envelope. A survey packet was mailed on November 29, 2022 to households that had not responded to the initial request. The packets were mailed in a 6×9 inch envelope and included: (1) a paper questionnaire booklet, (2) a 6×9 inch postage prepaid business reply envelope, and (3) a cover letter with information on how to complete the survey online. The experimental conditions remained constant across both mailings; the cover letters for addresses that were randomly assigned to the QR code+URL condition included both the unique URL and QR code while the cover letters for addresses that were randomly assigned to the URL only condition included the unique URL. All letters/envelopes were addressed to “STATE Resident” and contained instructions for within household selection.
We compared mean response rates arising from the initial invitation, following the packet mailing, and the overall response rates between the two experimental conditions using two-sample t-tests with equal variances. All web surveys that were completed by November 29th (the date of the packet mailing) were attributed to the initial mail invitation. Web surveys received on or after November 30th were attributed to the packet mailing. We created a series of binary variables for respondents who completed the questionnaire in each mode (PTW and SAM) and a combined binary variable for respondents who completed the questionnaire in either mode. Each variable was coded 1 for addresses where the survey was completed and coded 0 if the survey had not been completed. Addresses where the mailings were returned as undeliverable or vacant were coded as missing and excluded from analysis. Addresses where a member of the household completed the questionnaire following the initial mailing were coded as missing for the second mail recruitment materials. We tested for differences in response rates both overall and following each of the mailings. One-tailed hypotheses tests are used throughout unless otherwise specified. A pre-analysis plan was registered with Evidence in Governance and Politics (EGAP) prior to the start of data collection.
To assess whether the inclusion of the QR code facilitated the participation of younger and/or lower socioeconomic status respondents (based on education and income), we compared the demographics of the respondents obtained from each experimental condition to each other and to benchmarks for the state from the March 2022 Current Population Survey. Analyses of the respondent characteristics was limited to addresses where someone completed the questionnaire. We conducted difference-in-proportions tests to evaluate statistical significance. We hypothesized possible differences based on age, education, and income, however, we also considered other available demographic variables including: marital status, race, and sex. We combined responses received on the web or by mail for the respondent composition analyses. We did not use survey weights for any of the analyses described in this article since our focus was on survey participation.
The demographic variables on the questionnaire were measured using multiple choice items with categories designed to allow the data to be weighted to the population benchmarks. These items specified ranges for age group (7 categories) and income. Income was measured with eight distinct categories, though, the lowest two income groups “less than $15,000” and “$15,000 to less than $25,000” were collapsed into a single category, “less than $25,000” for analyses. Education was measured with the following categories: less than high school graduate, grade 12 or GED (high school graduate), some education beyond high school (no degree awarded), trade certification or vocational training, associate (2-year) degree, bachelor’s (4-year) degree, graduate or professional degree (MA, MBA, PhD, MD, JD). Less than high school graduate and grade 12 or GED (high school graduate) were coded together as “no college.” Some education beyond high school (no degree awarded), trade certification or vocational training, and associate (2-year) degree were coded together as “some college.” Bachelor’s (4-year) degree and graduate or professional degree were kept separate as their own categories. This results in four education categories: no college, some college, 4-year college degree, and graduate degree. Hot-deck imputation was used to account for item nonresponse (Mukhopadhyay 2016). Both the imputation and collapsing the income and education categories were specified in the registered pre-analysis plan.
Results
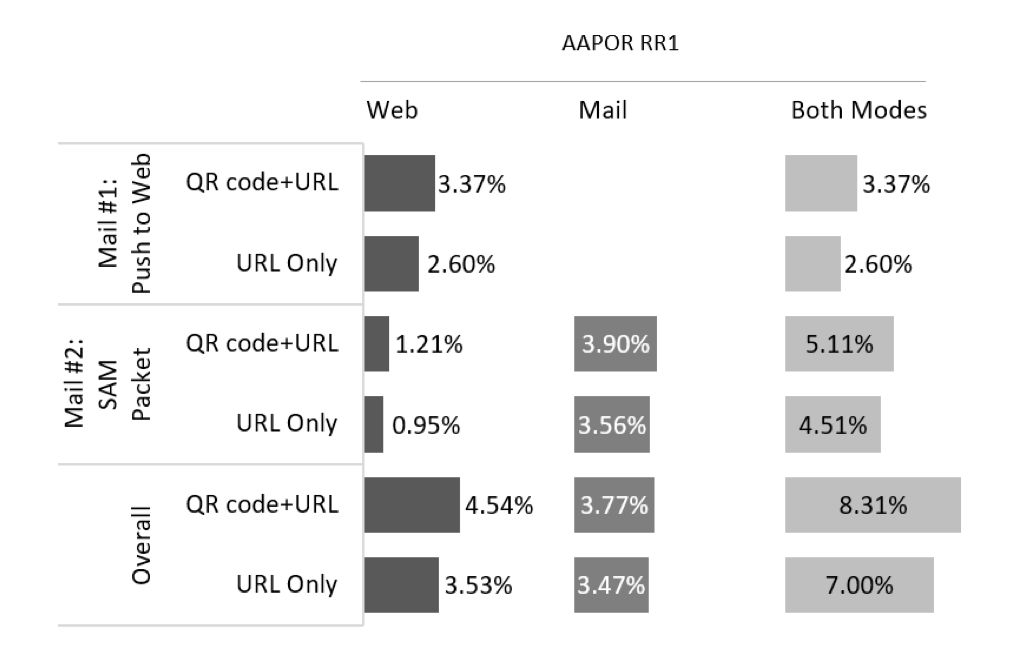
Data collection from the statewide probability ABS sample for the 2022 STEM survey produced an overall American Association for Public Opinion Research (AAPOR) Response Rate 1 of 7.88%. The overall response rate for the URL only condition was 7.00% while the response rate for the QR code+URL condition was 8.31%, a difference of 1.31 percentage points (p<.05) as shown in Figure 1. In addition to having a higher overall response rate, the inclusion of the QR code resulted in a higher percentage of overall completions on the web (4.54%) compared to the URL only condition (3.53%), a difference of 1.01 percentage points (p<.05). Figure 1 also displays the completions received on the web and by mail following the initial PTW invitation and the packet mailing. When separately considering the percentage of mailings that yielded a completed questionnaire following each of the two mailings, the percentage was higher among addresses assigned to the QR code+URL condition at each of these time points, though these differences were minor and were not statistically significant.
Figure 1. Response rate by URL only or QR code+URL condition and mode
We next considered the composition of the respondents obtained from each condition by comparing them to each other using difference-in-proportion tests. We theorized that the inclusion of QR codes would improve recruitment among younger respondents, less formally educated respondents, and lower-income respondents. We focused on the demographic variables where we hypothesized that the inclusion of the QR code would result in a greater percentage of respondents from hard-to-reach populations beginning with respondents in the 18 to 24 years old and 25 to 34 years old age groups. The percentage of respondents aged 18 to 24 was essentially the same in both the URL only condition at 0.83% and the QR code+URL condition at 1.03%. However, there were statistically significant differences between the conditions for the 25 to 34 age group with 4.96% of respondents from the URL only condition in this category compared to 11.00% of respondents recruited from the QR code+URL condition. While the QR code+URL condition produced a greater percentage of respondents from the 25 to 34 age group with a 6.04 percentage point increase compared to the URL only condition (p<.05); the percentage still fell short of the population benchmark of 17.15%. Overall, the QR code+URL condition resulted in an age distribution that more closely resembled the state. For each of the age groups, the percentage of respondents among the QR code+URL condition is closer to the population benchmark than the URL only condition, as shown in Table 1. However, respondents from the oldest age groups (65-74 and 75+) are significantly overrepresented in both conditions relative to their share of the state’s population.
We also hypothesized the inclusion of a QR code would yield a higher percentage of respondents without a 4-year college degree, which is comprised of respondents whose highest level of education was a high school degree or less and respondents in the “some college” category, which included 2-year degrees, trade school, vocational training, and some education beyond high school. The inclusion of the QR code did not significantly affect the composition of the respondents based on their reported education levels with minimal differences between the conditions, especially among the “no college” category. Individuals with college degrees are overrepresented in both conditions, which may partly reflect the survey topics of STEM careers and education.
The final demographic variable where we hypothesized the inclusion of the QR code would improve the representativeness of the participants was household income where we expected a higher percentage of respondents making below $50,000 among the condition with the QR code. There were minimal differences between the experimental conditions for the “less than $25,000” and the “$25,000 to less than $35,000” household income categories. However, there were significant differences for the “$35,000 to less than $50,000” category between the conditions with 4.96% of respondents in the URL only condition in this category compared to 12.37% in the QR code+URL condition, a difference of 7.41 percentage points (p<.05). The percentage of respondents in the QR code+URL condition within the “$35,000 to less than $50,000” (12.37%) matches the statewide benchmark of 12.37%. In fact, the percentage within each income category is closer to the statewide benchmarks in the QR code+URL condition for six of the seven income categories. A particularly striking difference is for the household income category “$50,000 to less than $75,000” where the percentage of respondents in the QR code+URL condition (15.81%) approximated the statewide benchmark of 15.13%, while the percentage of respondents in the URL only condition (23.97%) was significantly higher than the statewide benchmark.
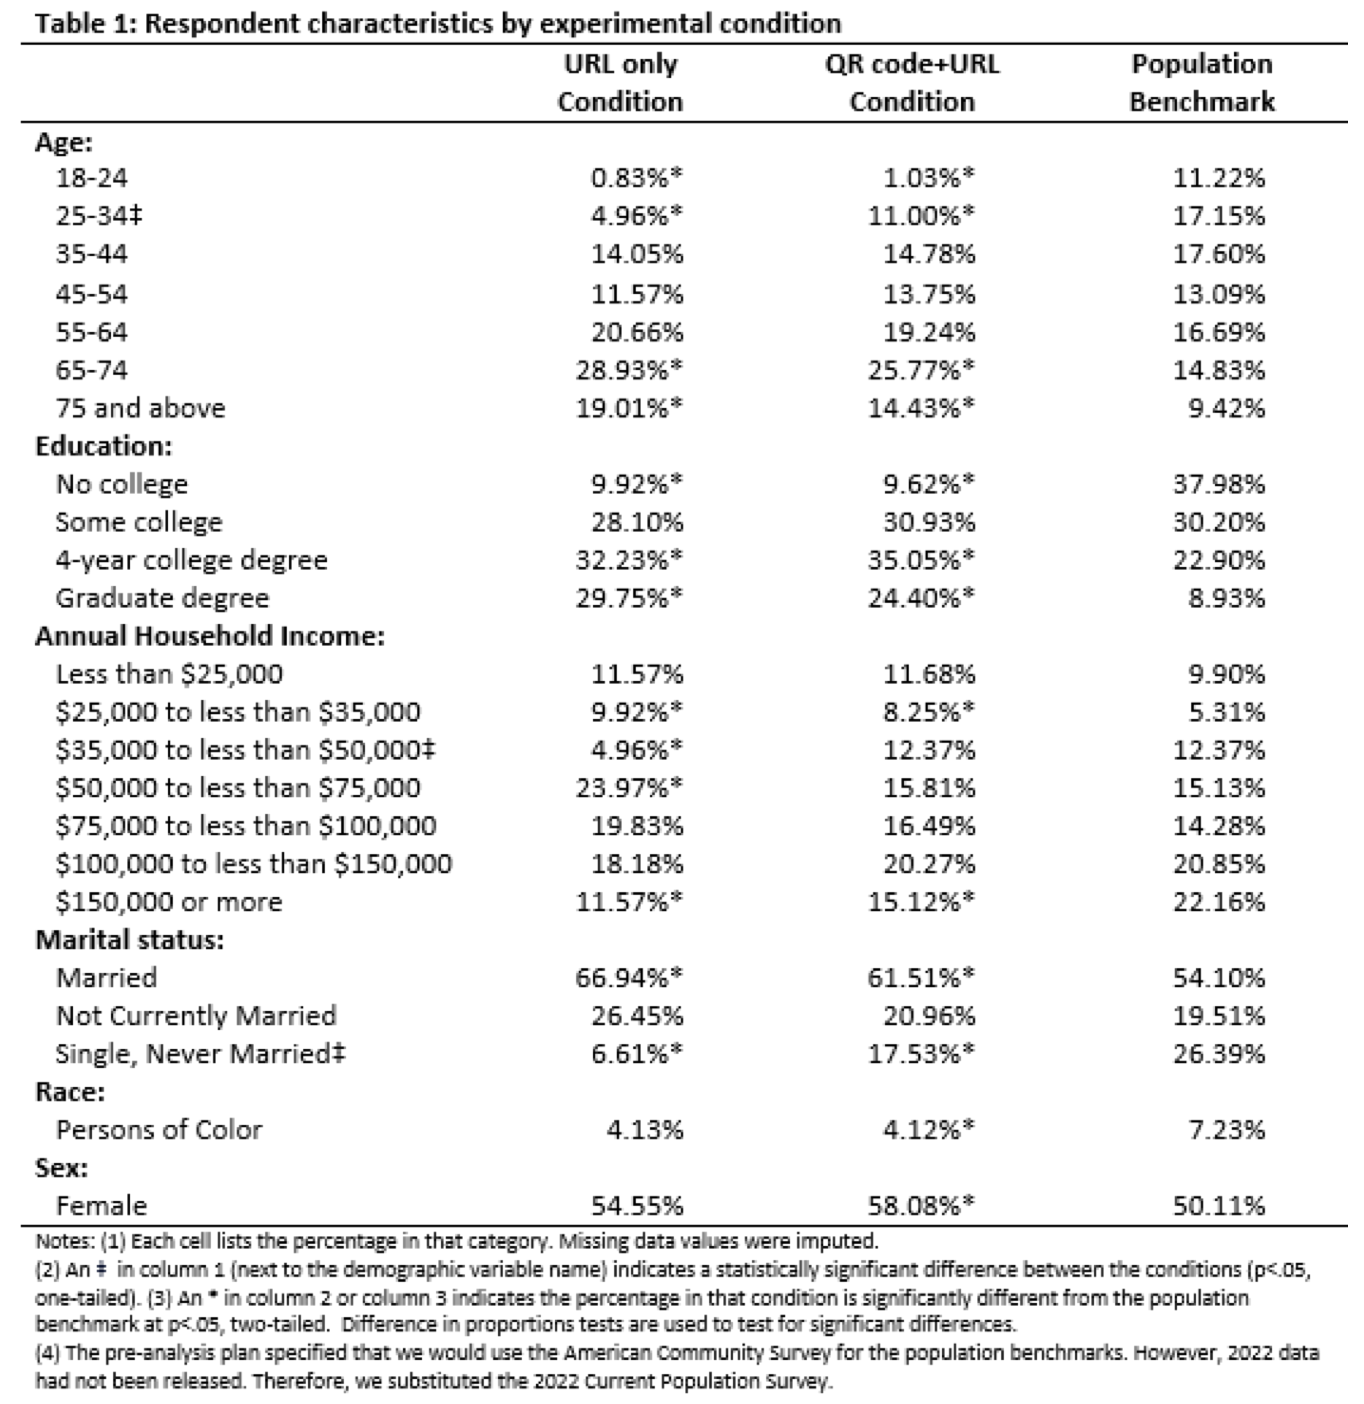
We did not have specific hypotheses regarding marital status, race, and sex, however, we did test for differences between the experimental conditions. A noteworthy difference emerged for marital status. We obtained a significantly higher percentage of respondents who have never been married in the QR code+URL condition (17.53%) than in the URL only condition (6.61%), a statistically significant difference of 10.91 percentage points (p<.01). Though, the percentage of never married respondents is still significantly lower than the statewide benchmark of 26.39%. The inclusion of the QR code in the mail recruitment materials did not improve the percentage of respondents that were a race other than white, which contrasts with the findings from Lee and colleagues (2023). However, this study was conducted in a state with less racial and ethnic diversity than their study in the U.S. city of Chicago.
Discussion
Results from this randomized experiment with a statewide probability ABS sample conducted with a sequential mixed-mode (PTW followed by SAM) survey suggests that incorporating QR codes into mailed survey recruitment materials can modestly improve response rates. These findings align with prior studies conducted with a statewide DF-RDD sample with appended addresses (Endres et al. 2023) as well as a city-wide survey (Lee et al. 2023). However, the findings contrast with an earlier study fielded in 2015 when QR codes were less prevalent and could not be accessed on many smartphones without downloading an application to read the QR code (Marlar 2018). It also contrasts with a recent non-U.S. study in the Netherlands that did not find improved response rates when outreach materials included the QR code (Lugtig and Luiten 2021).
The QR codes also yielded higher proportions of participants from some demographic groups that generally participate at lower rates. Specifically, we found the QR codes significantly increased the proportion of survey respondents that were single (never married), the proportion of lower income respondents, and the proportion of younger respondents. While we hypothesized improved participation among respondents with annual household incomes below $50,000, we only found a significant increase among those in the $35,000 to less than $50,000 category. Similarly, we hypothesized a better response rate among younger respondents under the age of 35, though the QR code only produced a significant increase for the 25 to 34 age group. However, the percentage of respondents among the QR code+URL condition is closer to the population benchmark than the URL only condition for every age group and produced an age distribution that more closely aligns with the age distribution in the state. We also hypothesized that the QR code would improve participation among respondents without a college degree; this hypothesis was not supported by the data and the null findings may be an artifact of the survey topic – STEM education. While the increased participation was statistically significant for some, but not all segments that are generally more challenging to recruit, we view the increased participation among some of the lower-income and younger age groups as a successful outcome and suspect that future data collection efforts on content areas other than education may find improved participation among respondents with lower education levels when a QR code is in included in mailed recruitment materials. We also recognize the possibility that QR codes could be selectively deployed to some population segments that are more likely to rely upon smartphones for internet access.
This study provides further evidence that QR codes can be effectively incorporated into mailed survey recruitment materials, especially now that the costs associated with generating thousands of unique QR codes are no longer a barrier to implementation. While we plan to use QR codes in mailed survey recruitment materials in our state going forward, more research is needed to confirm the efficacy of QR codes in other jurisdictions such as other countries where the use of QR codes may be less prevalent than the United States and/or regions where citizens are less dependent on smartphones. Additional experiments would also be beneficial for recruitment efforts that lead with a SAM booklet or concurrently offer the SAM booklet with all mailed outreach instead of initially sending PTW letters. Still, the findings in this and other contemporary studies signal that the inclusion of the QR code can both improve survey participation while also reducing some back-end costs with SAM studies that accrue from return postage and processing/data entry from SAM booklets.
References
- Allen, L., Marlar, J., & Steele, E. (2016). QR Codes for Survey Access: Is It Worth It?. In the 71st Annual Meeting of the American Association for Public Opinion Research. AAPOR
- Antonelli, W. (2022). “How to scan a QR code on your Android phone or tablet.” Business Insider. Retrieved from: https://www.businessinsider.com/guides/tech/scan-qr-code-android Accessed 09/12/2023.
- Apple. (2021). “Scan a QR code with your iPhone, iPad, or iPod touch.” Retrieved from: https://support.apple.com/en-us/HT208843. Accessed 09/11/2023.
- Dillman, D. A., Smyth, J. D., & Christian, L. M. (2014). Internet, phone, mail, and mixed-mode surveys: the tailored design method. John Wiley & Sons.
- Dimech, A. (2018). Easily create QR Code in Word. Retrieved from: https://code.adonline.id.au/qr-codes-in-microsoft-word/. Accessed 09/14/2023.
- Endres, K., Heiden, E. O., Park, K., Losch, M. E., Harland, K. K., & Abbott, A. L. (2023). Experimenting with QR Codes and Envelope Size in Push-to-Web Surveys. Journal of survey statistics and methodology, smad008.
- Endres, K., Losch, M.E., and McCoy, A. (2023). 2023 Iowa Digital Services Survey Summary Report & Focus Group Findings. University of Northern Iowa Center for Social and Behavioral Research. https://dom.iowa.gov/media/517/download?inline=
- Gostin, I. (2021) “How the pandemic saved the QR code from extinction.” Forbes. https://www.forbes.com/sites/forbescommunicationscouncil/2021/03/25/how-the-pandemic-saved-the-qr-code-from-extinction/?sh=798fc0f46905. Accessed 01/10/2022.
- Groves, R. M., Singer, E., & Corning, A. (2000). Leverage-saliency theory of survey participation: description and an illustration. Public Opinion Quarterly, 64(3), 299-308.
- Lee, N., Scott, L., Lewis, T., Prachand, N., Singh, M., and Matzke, H. (2023). “The Use of QR Codes to Increase Rate of Survey Participation in a Web Survey.” In 78th Annual Meeting of the American Association for Public Opinion Research. AAPOR.
- Lugtig, P., & Luiten, A. (2021). Do shorter stated survey length and inclusion of a QR code in an invitation letter lead to better response rates? Survey Methods: Insights from the Field (SMIF). Retrieved from https://surveyinsights.org/?p=14216
- Marlar, J. (2018) Do Quick Response Codes Enhance or Hinder Surveys? Gallup Methodology blog, August 30 2018. https://news.gallup.com/opinion/methodology/241808/quick-response-codes-enhance-hinder-surveys.aspx
- Mukhopadhyah, P.K. (2016) Survey Data Imputation with PROC SURVEYIMPUTE. SAS Proceedings. https://support.sas.com/resources/papers/proceedings16/SAS3520-2016.pdf
- Perrin A. (2021), “Mobile Technology and Home Broadband 2021,” Pew Research Center. Available at https://www.pewresearch.org/internet/2021/06/03/mobile-technology-and-home-broadband-2021/.
- Pew Research Center (2021) “Internet/Broadband Fact Sheet” https://www.pewresearch.org/internet/fact-sheet/internet-broadband/?menuItem=2ab2b0be-6364-4d3a-8db7-ae134dbc05cd.
- Rivas, A. G., & Schulzetenberg, A. (2023, July). QR Codes as a Method for Older Adults to Access a Mobile Survey. In International Conference on Human-Computer Interaction (pp. 128-141). Cham: Springer Nature Switzerland.
-
Keywords
calibration CATI coverage coverage bias cross-national surveys data linkage data quality European Social Survey experiment face-to-face face-to-face survey Facebook hard to reach populations incentives item nonresponse measurement measurement error mixed-mode surveys multitasking non-probability samples Nonresponse nonresponse bias nonresponse rates paradata PIAAC Probability sample probability samples QR codes rare populations response rate Satisficing social desirability Social media survey survey-taking climate survey data survey management survey methods Telephone survey telephone surveys total survey error unit nonresponse validity web survey Web surveys weighting
