Is it Helpful to Include QR Codes on Mail Contact Materials for Self-Administered Web Surveys?
Lewis, T., Lee N., Palmer, D., Freedner, N., Matzke, H. & Prachand N. (2025). Is it Helpful to Include QR Codes on Mail Contact Materials for Self-Administered Web Surveys? Survey Methods: Insights from the Field. Retrieved from https://surveyinsights.org/?p=?p=19898.
© the authors 2025. This work is licensed under a Creative Commons Attribution 4.0 International License (CC BY 4.0) 
Abstract
The Healthy Chicago Survey (HCS) is a self-administered, multimode survey conducted annually on a random sample of Chicagoans aged 18 years or older. The survey uses an address-based sampling frame and offers both web and paper modes, with a Choice+ data collection protocol offering a higher promised incentive for completing by web. Overall, about 90% of individuals take the HCS via web. Sampled households are sent a series of mailings inviting the adult who is next to celebrate a birthday to complete the survey. In the 2023 HCS administration, an experiment was fielded in which half of the mailings contained a QR code enabling immediate survey launch for individuals with smartphones, while the other half of mailings did not include a QR code. This paper summarizes differences observed across the two experimental groups with respect to response rates, electronic device type used, sociodemographic distributions, and key health indicator distributions.
Keywords
health survey, online survey methods, QR codes, survey methods, web survey
Acknowledgement
The authors would like to thank Abhik Das and the RTI Fellows Program for supporting the development of this paper. Disclaimer: The conclusions in the paper are those of the authors and do not necessarily represent the views of the Chicago Department of Public Health.
Copyright
© the authors 2025. This work is licensed under a Creative Commons Attribution 4.0 International License (CC BY 4.0) 
Background
In recent years, practitioners of web-based surveys have increasingly adopted the use of quick response (QR) codes on contact materials. QR codes are appealing because they can be read by a smartphone to instantly launch a survey. That is, because the survey’s URL and unique log-in information can be embedded within the QR code, a respondent can begin the survey without having to first open a web browser and key in those two fields, respectively. However, despite their rising popularity, and the estimated 90% of the U.S. adult population who own a smartphone (Gelles-Watnick, 2024), relatively little experimentation about the impact of including QR codes has been published. Findings thus far have been mixed. For example, Lugtig and Luiten (2021) reported on a randomized experiment that found including a QR code led to higher rates of completing the survey by smartphone, albeit with a slightly higher breakoff rate, but no clear differences were observed with respect to response rates. In a research note published a few years earlier, Marlar (2018) also found no effect of including a QR code on response rates, while Smith (2017) actually found that including QR codes reduced response rates. More recently, Endres et al. (2024) found that including QR codes on mail contacts significantly increased a multimode web and telephone survey’s response rate; granted, the increase was only 1.2 percentage points. A similarly modest increase was reported in Endres, Heiden, and Park (2024) for a web/paper mixed-mode survey: adding a QR code increased the response rate by 1.3 percentage points. And a 2022 experiment discussed in Marlar and Schreiner (2024) found a 1.4 percentage point boost by including QR codes on contact materials for a comparable web/paper mixed-mode survey design.
Comparing results from the 2021 and 2022 administration of the Healthy Chicago Survey (HCS), Lee et al. (2023) found results concomitant with Lugtig and Luiten (2021). The QR code condition produced a much higher rate of completes via smartphone, yet was coupled with a twofold increase in the breakoff rate. Another data collection metric considered by Lee et al. (2023) was the American Association of Public Opinion Research (AAPOR) Response Rate 3 (RR3) (AAPOR, 2023), which excludes the breakoffs (i.e., partial completes) from the numerator. The AAPOR RR3 calculation was slightly lower in the QR code condition: 29.6% vs. 31.1%. The QR code condition would have been higher using the AAPOR RR4 calculation, which includes the breakoffs in the numerator, but because those cases are not retained on the analysis data set and the official calculation reported in the HCS methodology report is RR3, that seems the more appropriate variant to consider.
While generally aligned with the (limited) prior literature, a criticism of the analyses presented in Lee et al. (2023) is that they were based on a natural experiment occurring in HCS whereby QR codes were first introduced for the entire sample in the 2022 administration and compared against results from the HCS administration one year prior. As a follow-up study addressing this critical limitation, a randomized experiment was conducted during the 2023 HCS administration in which one-half of the sample was sent contact materials containing a QR code while the complementary half was sent contact materials without a QR code. The purpose of this paper is to present results from that experiment, with an attempt to answer the following research questions:
- Does including QR codes on contact materials increase the survey’s response rate?
- Does including QR codes on contact materials change the distribution of electronic device used for web survey respondents?
- Does including QR codes on contact materials impact sociodemographic distributions or the distributions of key health indicators?
This paper is structured as follows. More background on the HCS and a description of the QR code experiment is provided in the Data and Methods section. The Results section contains side-by-side comparisons of disposition codes and response rates, the electronic devices used to complete the survey, sociodemographic distributions of respondents, and point estimates of key health indicators. The Discussion section concludes with a brief summary and ideas for further research.
Data and Methods
Data analyzed in this paper were collected as part of the 2023 HCS. Sponsored by the Chicago Department of Public Health (CDPH), HCS began in 2014 as an annual, dual-frame, random-digit dial (DFRDD) telephone survey of adults in Chicago. Statistics generated from the HCS have been used to support the implementation of Healthy Chicago 2.0 (https://www.chicago.gov/city/en/depts/cdph/provdrs/healthychicago.html) and to develop a wide range public health interventions and policies to address health inequities. Between 2014-2018, five cycles of data collection were conducted, each yielding approximately 2,500–3,000 completes.
As discussed in Unangst et al. (2022), the 2020 HCS was the first cycle to transition away from DFRDD to a self-administered, mail contact format using an address-based sampling (ABS) frame (English et al., 2019). Addresses on the frame, which serve as a proxy for households, are geocoded and stratified into 77 community areas across the city of Chicago, and a sample is selected over two successive releases targeting a minimum of 35 completes per community area and, in 2023 HCS, 5,250 completes overall. Instructions are provided to have the adult in the household next to celebrate a birthday complete the survey (Smyth et al., 2019).
The 2023 HCS was conducted using a sequential Choice+ data collection protocol (Lewis et al., 2022) whereby sampled households were first offered a web mode exclusively for a $30 promised incentive, and later offered both web and paper, with a $20 promised incentive for completing by paper. Each sampled household received up to four mailings. The first two mailings were (1) an initial invitation letter with a $2 unconditional incentive for web participation and (2) a reminder postcard sent one week later. The final two mailings were (3) a paper survey packet (also containing web participation information) sent to nonresponding households three weeks after the initial invitation letter and (4) a reminder postcard sent to nonresponding households one week thereafter.
During the second sample release of the 2023 HCS, with a data collection window occurring between November 8, 2023 and January 4, 2024, a total of 12,858 addresses were randomly assigned to one of two groups. The first grouping of 6,429 addresses was sent contact materials containing a customized QR code to expedite survey launch, while the second grouping of 6,429 addresses was sent comparable contact materials without a QR code. Side-by-side examples of all four mailings are provided in the Appendix.
By the close of the data collection, a total of 2,661 survey completes were obtained, for an overall yield rate of 2,661 / 12,858 = 20.7%. A vast majority of the completes, 92%, came via web, with 57% of those by smartphone. Respondents were more likely female (62.9%) and tended to be higher educated (48.7% with a college degree). With respect to respondent age, 16.9% were under 30 years of age, 61.3% were between 30 and 64 years of age, and 21.8% were 65 or older. There were 23.0% Hispanic, 34.6% non-Hispanic White, and 29.8% non-Hispanic Black respondents. Roughly 31.2% of respondents reported residing in a household with one or more children, while 37.4% of respondents reported living alone. Because item nonresponse rates for these demographics (and key health outcomes) were modest (< 5%), no imputation was performed. Two-sample t-tests were used to compare response rates and web device distribution percentages across the two QR code conditions, and chi-square tests of association were used to compare multinomial distributions.
Results
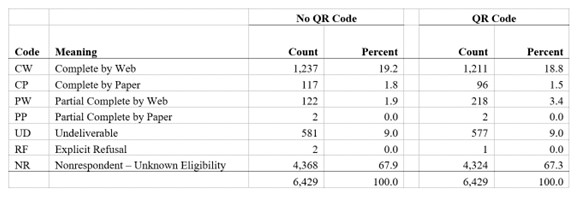
Table 1 summarizes the seven disposition codes currently used in HCS and the respective percentages of those codes across the two experimental conditions. To be considered a complete, a respondent must have answered at least four of the eight demographic items in the survey used to create the nonresponse-adjusted analysis weights. Partial completes are respondents who answered between one and three of these items. The QR code condition produced about 77% more partial completes (3.4% vs. 1.9%) and, amongst completes, encouraged a higher rate of participation via web (92.7% vs. 91.4%). However, the QR code condition produced a slightly lower response rate, per the AAPOR RR3 calculation, at 28.0% vs. 29.3%, yet this difference is not significant at the α = 0.05 level. Hence, with respect to our first research question, we have no evidence in the HCS that contact materials containing QR codes improve the survey’s response rate.
Table 1: Counts and Percentages of Disposition Codes in the 2023 HCS by QR Code Experimental Condition.
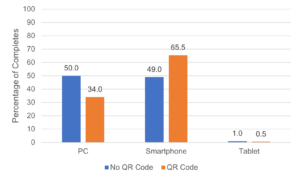
With respect to our second research question, Figure 1 demonstrates how including QR codes on contact materials increased the likelihood that an individual completing the survey electronically would do so using a smartphone. While the rates of PC/smartphone are approximately equivalent in the condition absent QR codes (50% vs. 49%), including QR codes prompted individuals to be almost twice as likely to complete the survey via smartphone (65.5% vs. 34.0%) (p < 0.01). In both conditions, rates of completing the survey via tablet are miniscule. While confirming what has previously been reported by Lugtig and Luiten (2021) and Lee et al. (2023), this result is perhaps to be expected considering the presence of a QR code should only serve to encourage smartphone usage over other electronic devices with web access.
Figure 1: Distributions of Device Type Used for 2023 HCS Web Respondents based on QR Code Experimental Condition.
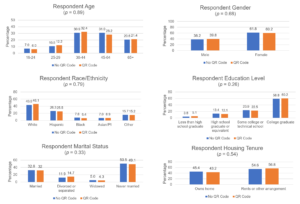
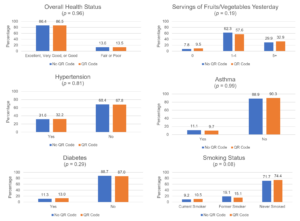
The next two figures are provided to help answer the third research question, does including QR codes impact sociodemographic variable distributions and the key health indicators measured by HCS? Figure 2 presents side-by-side sociodemographic distributions across the two conditions, and Figure 3 presents the like for key health indicators. Both figures are based on unweighted data. The six variables selected for each figure were derived from a subset of those analyzed in Unangst et al. (2022) and Lewis et al. (2022). Although a few categories of a given variable’s distribution appear slightly different across the two experimental conditions, none of the p-values from a chi-square test of association fell below the conventional α = 0.05 significance level. These p-values are reported in parentheses below the distributions’ titles. Thus, for the HCS target population, including QR codes on contact materials appears to have no substantive impact on either sociodemographic variables or key health outcomes.
Figure 2: Sociodemographic Distributions of 2023 HCS Respondents by QR Code Experimental Condition.
Figure 3: Distributions of Health Outcomes of 2023 HCS Respondents by QR Code Experimental Condition.
Discussion
This paper presented results from an experiment fielded during the 2023 HCS in which one-half of the sampled households was sent contact materials containing a QR code to enable immediate electronic entry into the web-based survey from a smartphone (or tablet), while the other half was sent comparable materials without a QR code. We carried out the experiment to build upon the limited literature published to date and to determine whether findings of a natural experiment (Lee et al., 2023), when QR codes were included on all contact materials for all sampled households for the first time in 2022 HCS, would be upheld in a randomized experiment.
Generally speaking, the natural experiment findings were upheld. The presence of a QR code significantly increased the rate of electronic completes obtained via smartphone and reduced the portion of individuals completing the survey by paper. An increased rate of completion by smartphone has been noted repeatedly in prior QR code experiments as well—see, for example, Lugtig and Luiten (2021) and Marlar and Schreiner (2024). The QR code condition in our study produced a higher rate of breakoffs and a slightly lower AAPOR RR3 response rate, albeit a difference that was not statistically significant. This matches what was observed by Smith (2017) but is at odds with recent studies by Endres et al. (2024), Endres, Heiden, and Park (2024), and Marlar and Schreiner (2024) that found modest increases in response rates including a QR code on contact materials. Lastly, we did not uncover any noteworthy differences in sociodemographic variable distributions or key health indicators captured by the HCS. In contrast, Endres, Heiden, and Park (2024) found QR codes boosted rates of younger, never married individuals who tended to be of a lower socioeconomic status, and Marlar and Schreiner (2024) found them to help increase the rate of Hispanic respondents.
Although we suspect QR codes will continue, if not gain, in popularity in the future, our findings have one important implication for practitioners of web surveys. On occasions where one wishes to discourage individuals from using a smartphone to complete a web-based survey (e.g., questionnaire format is deemed superior on a PC, usability testing uncovers issues), it would be prudent to exclude the QR code launch option from contact materials. The potential impact of this design option, however, may be quickly diminishing as individuals’ device preferences evolve. In the 2021 HCS, when no QR codes were included, Lee et al. (2023) reported 63.2% of electronic completes came via PC versus 35.4% via smartphone. Two years later, per Figure 1, the no QR code condition in the 2023 HCS yielded roughly 50% for both PC and smartphone, respectively.
The mixed results in the published literature on the impact of QR codes on response rates suggests to us that there may be an interaction between their presence and what other, if any, modes are made available to the respondent. It seems plausible that including a QR code could improve response rates to a strictly web-based survey, but offering it alongside other access methods/instructions, or in tandem with a paper survey option, as was done in the 2023 HCS (see Figures A.3 and A.4), may lessen the impact, or potentially backfire if offering the individual too many mode choices (Schwarz, 2004; Millar and Dillman, 2011). A future replication of this study with a portion of the sample allocated to a web-only QR code experiment could prove insightful in that regard, as would additional studies with other mode combinations.
Appendix: Examples of 2023 HCS Contact Materials with and without a QR Code
References
- American Association for Public Opinion Research. (2023). Standard definitions: Final dispositions of case codes and outcome rates for surveys. 10th Edition. https://aapor.org/wp-content/uploads/2023/05/Standards-Definitions-10th-edition.pdf.
- English N., Kennel T., Buskirk T., & Harter R. (2019). The construction, maintenance, and enhancement of address-based sampling frames. Journal of Survey Statistics and Methodology, 7, 66–92.
- Endres K., Heiden E., Park K., Losch M., Harland K., & Abbott A. (2024). Experimenting with QR codes and envelope size in push-to-web surveys. Journal of Survey Statistics and Methodology, 12, 893–905.
- Endres K., Heiden E., & Park K. (2024). The effect of quick response (QR) codes on response rates and respondent composition: Results from a statewide experiment. Survey Methods: Insights From the Field. https://surveyinsights.org/?p=19389.
- Gelles-Watnick R. (2024). Americans’ use of mobile technology and home broadband. Pew Research Center Report. https://www.pewresearch.org/wp-content/uploads/sites/20/2024/01/PI_2024.01.31_Home-Broadband-Mobile-Use_FINAL.pdf.
- Lee N., Lewis T., Scott L., Prachand N., Singh M., & Matzke H. (2023). The use of QR codes to increase rate of survey participation in a web survey. Presentation given at the annual conference of the American Association for Public Opinion Research. Philadelphia, PA.
- Lewis T., Freedner N., & Looby C. (2022). An experiment comparing concurrent and sequential choice+ mixed-mode data collection protocols in a self-administered health survey. Survey Methods: Insights from the Field. https://surveyinsights.org/?p=17134.
- Lugtig P., & Luiten A. (2021). Do shorter stated survey length and inclusion of a QR code in an invitation letter lead to better response rates? Survey Methods: Insights from the Field. https://surveyinsights.org/?p=14216.
- Marlar J. (2018). Do quick response codes enhance or hinder surveys? Gallup Methodology Blog. https://news.gallup.com/opinion/methodology/241808/quick-response-codes-enhance-hinder-surveys.aspx
- Millar M., & Dillman D. (2011). Improving response to web and mixed-mode surveys. Public Opinion Quarterly, 75, 249–269.
- Schwartz B. (2005). The paradox of choice: Why more is less. New York: Harper Perennial.
- Smith P. (2017). An experimental examination of methods for increasing response rates in a push-to-web survey of sport participation. Paper presented at the 28th Workshop on Person and Household Nonresponse. Utrecht, the Netherlands.
- Smyth J., Olson K., & Mathew S. (2019). Within-household selection methods: a critical review and experimental examination. University of Nebraska Sociology Department Faculty Publication No. 753. https://digitalcommons.unl.edu/sociologyfacpub/753.
- Unangst J., Lewis T., Laflamme E., Prachand N., & Weaver K. (2022). Transitioning the Healthy Chicago Survey from a telephone mode to self-administered by mail mode. Journal of Public Health Management and Practice, 28, 309-316.


