

Improving Central Monitoring of Fieldwork in Cross-national Surveys: The Case of the Fieldwork Management System in the European Social Survey
Briceno-Rosas, R., Butt S. & Kappelhof, J. (2020). Improving Central Monitoring of Fieldwork in Cross-national Surveys: The Case of the Fieldwork Management System in the European Social Survey in Survey Methods: Insights from the Field, Special issue: ‘Fieldword Monitoring Strategies for Interviewer-Administered Surveys’. Retrieved from https://surveyinsights.org/?p=11866
© the authors 2020. This work is licensed under a Creative Commons Attribution 4.0 International License (CC BY 4.0) 
Abstract
Cross-national surveys face the particular challenge of trying to balance optimal survey quality within a country with comparability across countries in terms of data quality. Addressing this challenge during fieldwork requires effective management of fieldwork data, a task made more difficult by the inherent differences between countries. This article argues that changes to the comprehensiveness, timeliness, consistency, and accessibility of fieldwork data facilitate monitoring and represent a necessary step forward towards achieving optimal data quality in cross-national surveys. It discusses the approach of the European Social Survey (ESS) for monitoring fieldwork cross-nationally, and specifically, the improvements made to central monitoring with the introduction of the Fieldwork Management System (FMS). Through real-life examples of the use of FMS by the central team, the article reflects and discusses the impact of the changes to fieldwork monitoring. The ESS experience demonstrates that there is more than one way to realise the benefits of improved fieldwork data management and provides insights about the process of improving central monitoring of fieldwork for other cross-national surveys.
Keywords
central fieldwork monitoring, cross-national surveys, data management system, data quality, ESS, face-to-face, survey management
Acknowledgement
The Fieldwork Management System was developed by CentERdata, University of Tilburg with funding from the European Union’s Horizon 2020 research and innovation programme under grant agreement No 654221 as well as funding from European Social Survey European Research Infrastructure Consortium (ESS ERIC) and the European Union’s FP7 Infrastructures Programme under grant agreement No 283646. We would also like to thank Niccolò Ghirelli and Achim Koch for their valuable input and support.
Copyright
© the authors 2020. This work is licensed under a Creative Commons Attribution 4.0 International License (CC BY 4.0)
1. Introduction
Monitoring fieldwork is vital to ensuring the quality of any survey. When done effectively, it enables researchers to take steps to maximise the potential of the sample, and to try to minimise errors associated with sample quality (representation) and survey measurement whilst the survey is still in the field (Biemer, 2010; Biemer & Lyberg, 2003). However, cross-national surveys face the particular challenge of maximising the survey quality in countries with diverse national contexts (Pennell et al., 2017) and minimising the impact of these national differences on comparability of survey data across countries (Smith, 2011). It requires making explicit trade-offs with respect to achieving optimal survey quality within a country and maintaining optimal comparability between countries in terms of survey data quality. Any attempts to successfully address this challenge during fieldwork requires researchers to be informed about what is happening in the field across countries, a task made more difficult by the inherent differences between countries.
Successful cross-national monitoring of fieldwork requires effective management of fieldwork data across diverse countries. It is a precondition to implementing any responsive (Groves & Heeringa, 2006) or adaptive (Schouten et al., 2012; Wagner, 2008) survey designs. Without adequate information about sample units and fieldwork progress, it is not possible to apply the knowledge about survey errors and data-driven models (e.g. Vandenplas at al., 2017) to effective strategies for the field. This article discusses the new approach taken by the European Social Survey (ESS) to address the challenge of managing and monitoring fieldwork data across multiple countries, focusing specifically on the experience of introducing an electronic central Fieldwork Management System (FMS) in ESS Round 9. It reflects on how the information exchange facilitated by the new monitoring system impacts on insights gained by central survey teams into fieldwork both across and within countries, thereby affecting the capacity to monitor and intervene effectively during data collection.
2. Choosing an Approach to Monitoring Fieldwork Cross-nationally
Cross-national surveys need to be able to monitor fieldwork consistently across countries in a way that remains sensitive to national differences in the availability of data collection technologies and infrastructure, survey experience and survey culture. The approach taken also needs to be practical when researchers are at least one step removed from the data collection process, located in a different country to the fieldwork agency, and bearing in mind that resources available for monitoring both locally and centrally are limited.
Different cross-national surveys have approached this challenge in different ways. Arguably, the approaches can be characterised based on the level of (de)centralisation – how much of the monitoring is done by the central team responsible for overseeing survey implementation across participating countries. One option is a highly-centralised approach such as that implemented by the Survey of Health, Ageing and Retirement in Europe (SHARE). The central team closely defines fieldwork activities and regularly monitors data received during fieldwork while suggesting solutions for spotted issues (Malter, 2014). All participating countries are required to use the same survey technology for collecting data (the Sample Management System and Blaise) which greatly facilitates central monitoring. However, costs of implementation are increased with significant investment in technology. SHARE has successfully rolled out the approach across 27 EU countries and Israel, but not all surveys can insist or afford a common technology for all countries. It may also pose a barrier to entry for some countries and it limits the flexibility of the survey.
Alternatively, cross-national surveys such as the World Values Survey (WVS) or the International Social Survey Programme (ISSP) have adopted highly-decentralised approaches to fieldwork monitoring. Central intervention is limited to setting minimum standards across countries (regarding for example the type of sampling design and the target net sample size) which national teams are responsible for implementing at their discretion. There is no involvement of the central team in monitoring fieldwork during data collection (http://www.worldvaluessurvey.org; ISSP Research Group, 2018). This approach provides flexibility to adapt to the national survey contexts, reduces the cost of implementation, and consequently, allows inclusion of more diverse countries in the survey. However, it sacrifices central oversight of fieldwork and the possibility for interventions to improve quality standards and cross-national comparability before data is deposited.
Another option is to adopt a more hybrid approach in order to try and reduce – as much as possible- the limitations that exist when adopting a purely centralised or decentralised approach in the cross-national context while also trying to keep -as much as possible- the advantages of each approach. This approach aims to find a balance between the ability to respond flexibly to national circumstances whilst at the same time providing central quality assurance and maintaining cross-national comparability. The European Social Survey (ESS) is an example of a cross-national survey that adopts such a hybrid approach. Consistent with its input harmonised approach to data collection the ESS aims for functionally equivalent survey designs, adopting standardised procedures and protocols throughout the survey life cycle while allowing for specific country contexts to be considered (Jowell et al., 2007). National teams (led by a National Coordinator) are responsible for applying ESS standards in nationally specific ways and appointing a suitable survey agency to conduct fieldwork in their country (European Social Survey, 2017). At the same time, the central team exercises close oversight of all aspects of data collection. Joint responsibility carries over into the monitoring of fieldwork with national teams taking the lead but always in consultation with the central team (www.europeansocialsurvey.org).
The success of the hybrid approach to fieldwork monitoring depends, however, on the flow of information between the national and central teams and how this is managed. Effective oversight is only possible if the central team has access to detailed information alongside the national team and this information is available in a timely and consistent manner across countries. To facilitate effective fieldwork monitoring in cross-national surveys using a hybrid approach, the data used for monitoring therefore needs to fulfil four main criteria. Data needs to be:
- Comprehensive: It should cover all possible outcomes (i.e. interview, non-contact, refusal, appointments, etc.), as well as characteristics of the sample units (i.e. geographic areas, demographic characteristics, etc.) and their allocation in the field (i.e. processing status, interviewer assignment, etc.). Whilst broad indicators at country level, like overall response rate, can inform whether to continue fieldwork or not, less aggregated indicators like regional or interviewer level response rates can suggest targeted strategies for how to improve performance. Fieldwork is a complex process and reliance on a single indicator can at best provide an incomplete picture.
- Timely: Data should reflect the most recent state of fieldwork possible so as to allow for meaningful intervention. Depending on the fieldwork period, the frequency of updates required may vary.
- Consistent: It should be possible to monitor progress using comparable indicators over the entire fieldwork period, across countries and between different survey rounds.
- Accessible: Shared responsibility for fieldwork monitoring means that all stakeholders need to have access to the same data so that they can engage in informed discussion and joint decision making.
The remainder of this article addresses how surveys can meet these criteria.
3. Improving the Central Monitoring of Cross-National Fieldwork Activities
Any cross-national surveys aiming to improve its central monitoring of fieldwork focus their efforts within the two branches of the Total Survey Error (TSE) framework; representation and measurement (Groves & Lyberg, 2010). To monitor the (progress during the) data collection stage with respect to representation effectively, it is necessary to be informed about the state of each sample unit throughout the fieldwork period. To monitor measurement, it is necessary to be informed about the answers to each question in the survey. This article focuses on the first type of monitoring.
The first pre-requisite for effective monitoring is having an instrument that records the state of the sample units. For this, the ESS uses “Contact Forms” to record information about each sample unit during fieldwork including the time, mode and outcome of each contact attempt made. These instruments are highly standardised and the resulting data is published in an integrated file for all countries ( European Social Survey, 2018) together with the main survey data. Furthermore, after data is published, the contact form (CF) data is used to produce headline quality indicators, like response rates, and conduct analyses about fieldwork quality of the ESS (see for example Beullens et al., 2016).
To monitor fieldwork, however, the second pre-requisite is that the central team has access to this CF data as fieldwork is being conducted. There are multiple factors that restrict the access to the CF data during fieldwork; a key one is the fact that countries in the ESS collect the data using different software and, in some cases, paper-and-pencil mode. In previous rounds, the minimum requirement during fieldwork was only that survey agencies, via National Coordinators, provide the central team with a fortnightly (weekly since Round 8) update via e-mail providing some basic aggregate-level information such as the total number of completed interviews (European Social Survey, 2015). The timing, format, and level of detail contained in these reports varied considerably between countries, making it difficult to build up a complete or comparable picture of fieldwork across countries. As a result, the ESS version of the hybrid approach to fieldwork monitoring struggled to meet the criteria for effective fieldwork monitoring. For the latest round (Round 9), ESS has therefore invested in a new electronic Fieldwork Management System (FMS) intended to provide a shared platform for the central receipt and processing of nationally-collated fieldwork data.
3.1 Introducing the Fieldwork Management System (FMS)
The electronic Fieldwork Management System (FMS) developed for ESS Round 9 aims to provide all ESS stakeholders – local fieldwork organisations, National Coordinators and the central Fieldwork Team- involved in monitoring fieldwork in each country with access to comprehensive, timely, standardised and shared information about the state of the sample units during fieldwork itself.
The FMS was developed for ESS by CentERdata, University of Tilburg as part of the EU-funded Horizon2020 project Synergies for Europe’s Research Infrastructures in the Social Sciences – SERISS (www.seriss.eu). The FMS draws heavily on the experience of the Sample Management System (SMS) used by SHARE (Malter, 2014) but has been adapted to accommodate the ESS’ hybrid approach to data collection and fieldwork monitoring. Two different versions of the FMS were correspondingly developed for ESS and tested in Round 9.
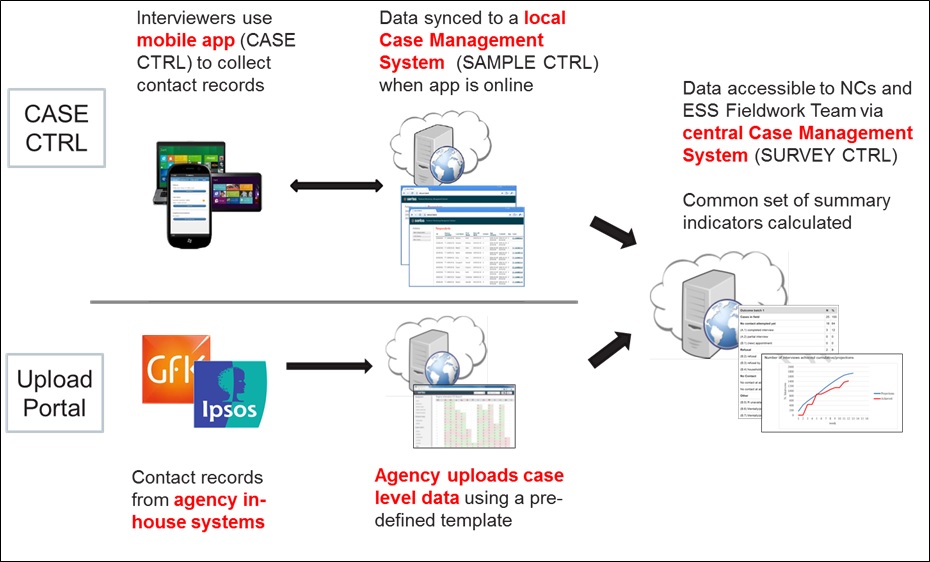
The first version, the CASE CTRL App, broadly mirrors SHARE’s original SMS and consists of a mobile app which interviewers can use in the field to record contact information about each sample unit. This information is then transmitted in “real time” (whenever the APP is online) back to a central database maintained by the local survey agency (SAMPLE CTRL) and visible through an online interface (SURVEY CTRL) to the central fieldwork team. Initially, the intention was that all participating ESS countries would adopt CASE CTRL. However, feedback from countries highlighted barriers to roll out ranging on the one hand from agencies’ with less well developed infrastructures voicing concerns about a lack of suitable local IT support to, on the other hand, agencies with their own well established in-house monitoring software being reluctant to adopt project-specific technology for a single survey (Butt et al., 2016).
A second version of the FMS – the FMS Upload Portal – was therefore developed. This accommodates national variation by allowing fieldwork agencies to retain their own in-house system for collecting the monitoring information whilst fulfilling the central team’s demand for standardised, timely and detailed monitoring information to be available for all countries during fieldwork. Countries are required to upload case-level data to an online portal on a weekly basis using a standardised template (see Appendix A). The upload frequency could be set to more frequent if desired. The information available for each case includes the date, mode, outcome and interviewer responsible for the last contact attempt.
Importantly, data uploaded to the FMS Upload Portal and data transmitted from CASE CTRL feed into the same online user interface, SURVEY CTRL (Figure 1). The central team can view a set of headline response indicators calculated in a consistent way for all countries as well as gaining access to the underlying data to conduct more bespoke analysis to inform fieldwork decisions as required. A full list of the summary indicators available is provided in Appendix B. Screenshots of the interface of the online platform are presented in Appendix C.
Figure 1. Versions of the FMS data process in the ESS
At the start of fieldwork (1st of September 2018) both versions were available for monitoring fieldwork. (More information about the FMS versions at https://seriss.centerdata.nl/page2.php)
3.2 Meeting the criteria to conduct effective fieldwork monitoring before and after the introduction of the FMS
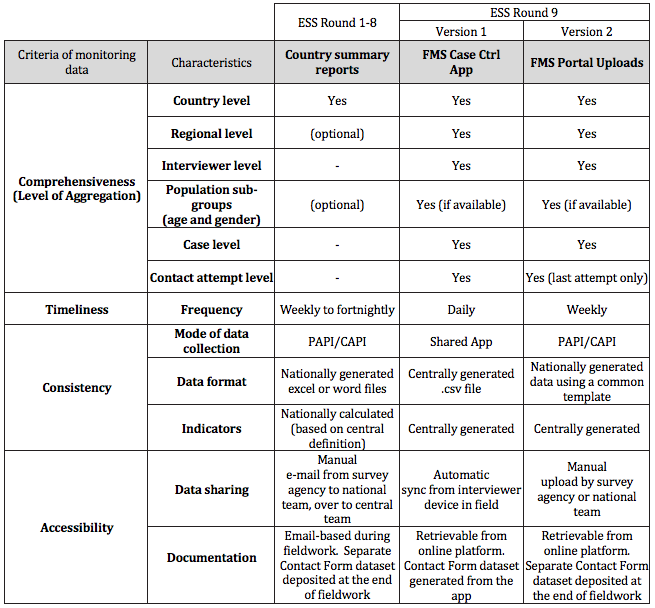
As mentioned in section 2, the introduction of the FMS in the ESS R9 should realise improvements with respect to these four criteria compared to the ESS’ ability to effectively facilitate the hybrid approach to fieldwork monitoring in previous rounds. Table 1 compares both versions of the FMS to the previous approach of the ESS on each of the criteria.
Comprehensiveness: In Round 1 to 8, the central team’s monitoring of the state of the sample was limited to the country level based on aggregate-level summaries generated by the countries. Some countries provided regional or demographic summaries as well, though this was optional and not very common (requiring more work from the national teams). The FMS allows the central team to receive data on each contact attempt made to sample units. Data can readily be broken down by geography, by sample demographics, and compared at the level of interviewers, case level or even by contact attempt. The potential for comprehending issues occurring during fieldwork thereby increases. The country level summary was sufficient to provide an overview and spot any major issues, but the more disaggregated indicators allow the central team to identify issues that would have been impossible at higher levels of aggregation and to investigate potential underlying causes. For example, interviewer level data enables monitoring interviewers that are under- and overperforming in the field, or identifying interviewers that deviate from the contact strategy. The Upload Portal is limited to the outcome of the last contact attempt in the week, rather than the full contact history as provided by CASE CTRL. Therefore, analyses that depend on information for each contact attempt, like checks on contacts attempts during weekends or in the evenings, are only possible with the latter.
Timeliness: From rounds 1 to 8 of the ESS, national teams sent the summary reports of fieldwork on a weekly to fortnightly basis (and often more sporadically depending on other demands on the NC’s time). A big advantage of CASE CTRL is that it transfers data automatically to the central teams on a daily basis. Data via the Upload Portal is still only available weekly (requiring a manual upload from the country teams and thereby making more frequent updates potentially burdensome). However, it is anticipated that the standardised upload procedure – and the fact that countries only need to provide data and not spend additional time generating indicators – should help to make the process more routine and better facilitate sticking to a weekly schedule.
Consistency: In previous rounds, the exact nature of the information provided – and the analyses conducted – varied considerably between countries despite the provision of central guidelines. The FMS ensures that a common set of headline indicators and summary reports are generated for all countries. The FMS Upload Portal accommodates variation in the mode in which underlying data were collected across countries (e.g. paper-and-pencil or computer-assisted contact forms) but the standardised upload template provides the basis for calculating common indicators across countries. Both the Upload Portal and CASE CTRL are integrated with Central Case Management system to allow consistent central monitoring of indicators across countries using either version of the FMS.
Accessibility: From Round 1 to 8, the data about fieldwork was collected and communicated via email. This meant another task for the national team and also meant that access was limited to the recipients of the email who could potentially miss or lose track of an update. The FMS makes the data and the indicators available in the online system accessible to all parties involved in the fieldwork monitoring (survey agency, national teams and the central team) for the duration of fieldwork. While the Upload Portal still requires a manual upload of the data, the CASE CTRL app facilitates the automatic transfer of data from the interviewer to the survey agency to the central team.
Compared to previous rounds of the ESS, the FMS should therefore provide more disaggregated, more frequent data on fieldwork. It standardises the production of common fieldwork indicators across countries and facilitates automatic sharing of the data between stakeholders. The Upload Portal has some limitations compared to CASE CTRL, but both represents a significant improvement over the information available to the central team in previous ESS Rounds based on the theoretical criteria mentioned above.
Improvements in all criteria should be reflected in a positive impact in the capabilities of effective fieldwork monitoring both across and within countries.
Table 1. Comparison of monitoring systems in the ESS: Country Summary Reports in ESS1-8, FMS CASE CTRL and FMS Upload Portal in ESS9
4. Monitoring ESS Round 9 Fieldwork with the FMS
How have the changes introduced by the FMS improved the central team’s insight on fieldwork, both between and within countries? How was the FMS received by users and how well did it work in practice?
To illustrate the usefulness of the FMS for effective central fieldwork monitoring, we present examples of analyses produced using the FMS data during ESS Round 9 fieldwork. According to the ESS specifications the ESS R9 fieldwork should have been conducted between the 1st of September 2018 and the 31st of December 2018. Fieldwork is expected take at least one month, but no more than 4 months i.e. a fieldwork period lasting between 4 to 5 and 18 to 19 weeks. The insights presented here therefore focus on the first 19 weeks of Round 9 fieldwork. We pooled the data used for monitoring fieldwork from the FMS online system in the 19th week of fieldwork (corresponding to the 17th January 2019). Because in practice some countries started fieldwork after 1st Sept and others were in the field longer than four months, as of January 2019, the ESS was still actively monitoring fieldwork for 21 European countries from the 22 countries that had started fieldwork. CASE CTRL was in use by four ESS Round 9 countries whilst the Upload Portal was in use by 18 countries.
The names of the countries have been removed from the results as the goal is not to diagnose the situation in any particular country but instead to illustrate the possibilities for monitoring in all countries. In some countries using the Upload Portal, data was not uploaded for one or two weeks; in these cases the data was imputed assuming an equal distribution between available data points. The examples showcase how the changes introduced by the FMS have helped the central team with monitoring fieldwork (1) across countries and (2) within each country.
4.1 Monitoring fieldwork across countries
Monitoring fieldwork at the country level enables the central team to have an overview of the progress of fieldwork across all countries. At this level, monitoring focuses on identifying different dynamics of fieldwork and spotting countries where interventions or more support from the central team might be required.
Survey response across countries
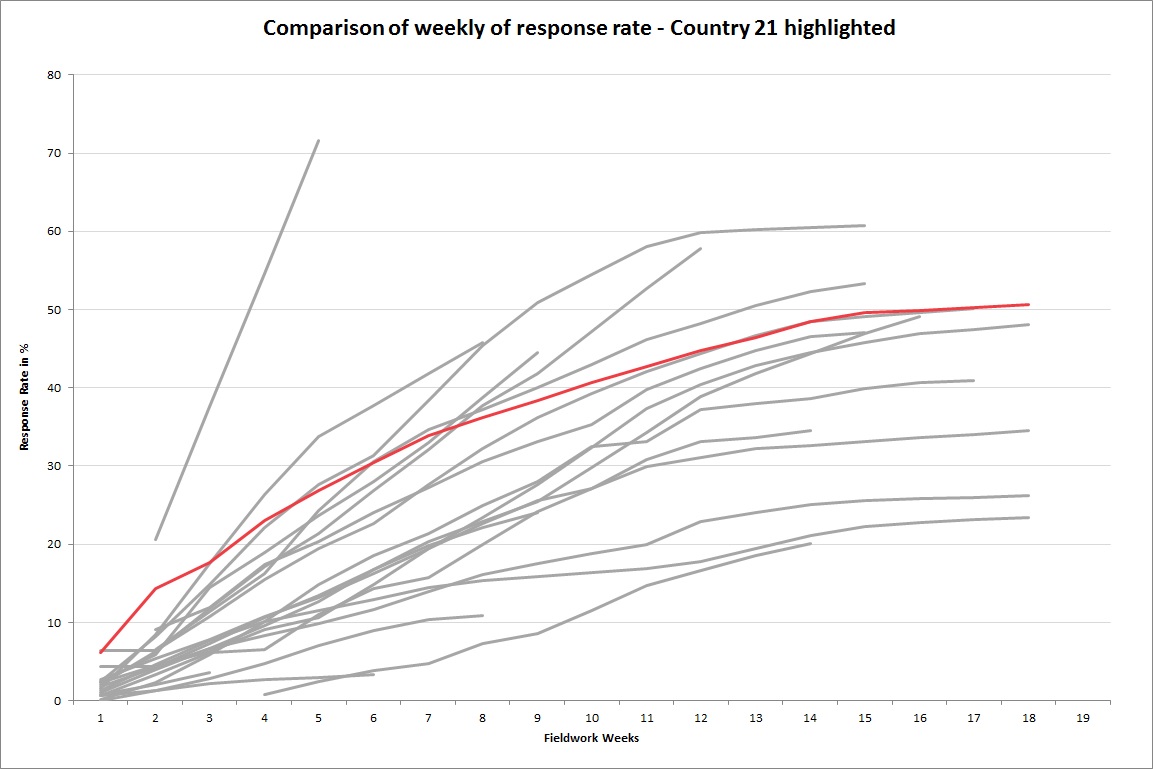
FMS data can be used to track overall fieldwork progress by monitoring the cumulative number of interviews (or the response rate) achieved by each country across each week of fieldwork. Progress can also be compared both to the country’s performance in the previous round and the country’s projected performance in the current round (as agreed with the fieldwork agency in advance of fieldwork and often informed by past performance). Consistently performing below target suggests the need for further investigation and possible intervention. Whilst similar analyses were possible in previous rounds, the FMS provides several advantages: Simple charts, such as those shown, are generated automatically within the FMS, reducing researcher effort and ensuring consistent calculations. It is also possible to compare the response rate of a country (for example country 21 as highlighted in Figure 2 by way of illustration of a regular development of the response rate in the ESS) to other countries in the field. We can also be confident that the calculation of the response rate is consistent across countries. Such differences in the response rates increase the importance of observing other indicators like the ones presented in the following examples.
Figure 2. Response rate ESS 9 in country 21 (red) in comparison to other countries in the field
Adherence to standards across countries
The FMS can also be used to monitor compliance against ESS standards. The non-contact rate needs to be below 3% in all countries and each case has to be visited at least four times before it can be declared a non-contact (European Social Survey, 2017). By combining the data on the state of each sample unit and their respective history of contact attempts, it is possible to calculate the compliance with the ESS standards on non-contact rate and contact strategy as shown in Figure 3. The blue column represents the non-contact rate for cases that are considered to be closed by the survey agency. If the non-contact rate (closed) is above the 3% threshold, then they are not compliant with the ESS standard. The red column represents the proportion of non-contact cases that have been closed without being visited at least 4 times, meaning that they are not compliant with the contact strategy of the ESS. Non-compliant countries should revise the affected cases, reopen cases, and invest further efforts in contacting sample units to achieve the targets before the end of fieldwork. There are some exceptions for planned deviations accepted prior to the start of fieldwork, for example due to the characteristics of the sampling frame. However, large rates of non-contact, like observed in countries 3 and 22, raise concerns about possible nonresponse bias and comparability of the samples. Identifying this issue during the field allows to further investigate the situation in the country and assess whether further efforts should be done before stopping fieldwork. These types of comparisons are possible for the central team of the ESS due to the availability of case-level data in the FMS. The non-contact rate is also calculated consistently across all countries, though there are some differences between the FMS Upload Portal and the CASE CTRL. The Upload Portal does not allow other outcomes for previous contact attempts, for example refusal, to be prioritised over non-contacts (the approach followed when calculating the final ESS outcome code). The Upload Portal may therefore slightly overestimate the final non-contact rate compared to CASE CTRL and consequently needs to be regarded separately.
Figure 3. Comparison of compliance with standards for non-contact rate and contact strategy across country – countries using the FMS Upload Portal

4.2 Monitoring fieldwork within each country
Monitoring at different levels within countries allows a better understanding of the local fieldwork situation and can help the central team to work effectively with the national teams to identify issues and guide strategies to overcome them. Indicators used within countries can also be aggregated to the country level to generate comparisons across countries along the lines previously presented.
Survey response at regional levels
The FMS allows systematic monitoring by geographic area, either region or Primary Sampling Unit (for clustered samples). Such a breakdown (not previously available for all countries or on a weekly basis) enables the central fieldwork team to identify differences in efforts or outcomes across areas which, if allowed to continue to the end of fieldwork, may lead to bias in the final sample.
Figure 4 shows the regional variation in country 19 for (a) percentage of cases with at least one personal visit – a good proxy for interviewer activity, and (b) response rate. With this information, the central team could encourage the national team to investigate the situation of Region 5, which was not only slow in contacting cases, but also the lowest response rate compared across regions. Further investigation by the national team revealed that many addresses might be secondary or summer residences of the respondents as they are in the coastal region of the country. This indicated that only increasing contact effort may not be sufficient to yield the desired results and that instead other strategies might be required to increase response in the region, for example at the level of the sampling design or frame prior to fieldwork.
Figure 4. Percentage of cases visited at least once, response rate per region in Country 19 – Region 5 highlighted in red.

Survey response of population sub-groups
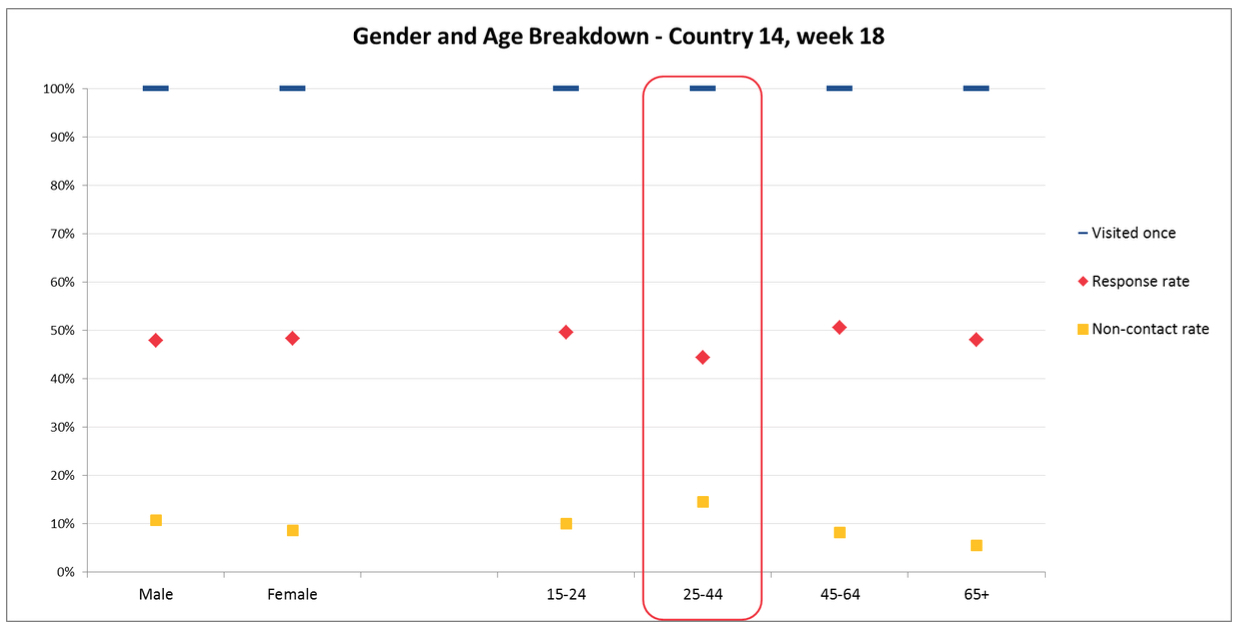
It is also possible to look at different response patterns across population sub-groups. With the FMS, the samples can be broken down into sub-groups based on demographic characteristics – age and gender – of the respondents, if this information is available on the sampling frame as shown in Figure 5. The percentage of cases visited at least once, the group response rate and non-contact rate for country 14 in week 18 can be observed. At this stage of fieldwork, the sample units in all groups have all been contacted at least once and response rates are fairly even across both sex groups. In the case of age groups, however, it seems harder to contact and get interviews from respondents age 25 to 44. Post-hoc analysis of previous rounds had indicated significant underrepresentation of younger respondents in this country when compared to the Labour Force Survey (Koch, 2018). This indicates that a known problem of bias is still present in the current fieldwork and that the country should come up with measures to reduce non-contacts and achieve more interviews from this age group if the bias is to be reduced.
Figure 5. Breakdown per gender and age groups – flagged group highlighted in red
Interviewer work and compliance with standards
Interviewers play a central role in face-to-face surveys. They are the main actors responsible for getting sampled persons to participate (thereby influencing representation) as well as conducting the interviews (thereby influencing measurement quality). Monitoring interviewers is therefore a key part of fieldwork monitoring.
Using the FMS, it is possible to monitor interviewers’ work patterns and compliance with ESS standards. FMS automatically calculates the proportion of interviewers with at least one contact attempt and with at least one interview in the last week. Large proportions of inactive or ineffective interviewers should raise concern. It can impact the overall sample quality (e.g. through lower response rates) or impact the cost of the survey by requiring longer fieldwork periods to fully process the sample.
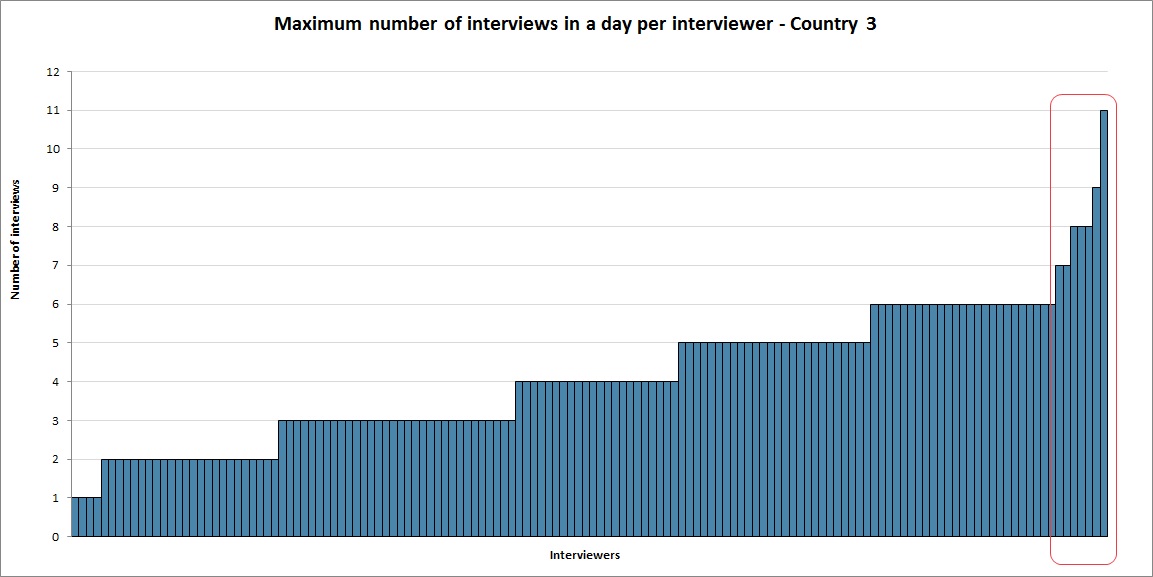
At the same time, extreme outliers due to high productivity may be reason for concern about the quality of work being done by interviewers. Interviewers with very high response rates can indicate behaviour uncompliant with survey standards (Winker, Menold, & Porst, 2013), a level of analysis available with the FMS data. By identifying outliers, the central team can request further investigation from the national teams, for example via back-checks. Another indicator that can help identify poor interviewer behaviour is the number of interviews that an interviewer completes on the same day as shown in Figure 6. In Country 3, for example, while most interviewers achieved six interviews or less on the same day, there are some that exceeded this number. One of the interviewers achieved eleven interviews on the same day, which seems highly unlikely considering the duration of a regular ESS interview. Such indicators, either on their own or in combination with others, cannot be taken as confirmation of suspicious behaviour but do at least serve to flag cases for further investigation by the national team. Monitoring fieldwork at the level of interviewers allows a better understanding of the dynamics involving key actors in the field and to react accordingly.
Figure 6. Maximum number of interviews achieved on the same day per interviewer in Country 3 – high performance outliers highlighted in red
4.3 FMS usability
The usefulness of the FMS for monitoring fieldwork depends, of course, on the quality of the data input which, in turn, depends on the successful interaction of national users – interviewers and survey agencies – with the tool. For CASE CTRL, provided that the necessary IT systems and set-up are in place within the survey agency and that interviewers have been well briefed in how to use the app, data collection and transfer is automated and therefore can be expected to proceed smoothly. Testing the FMS setup as part of national pre-testing and providing suitable training materials can help to ensure that this is the case. In contrast, the Upload Portal relies more heavily on the goodwill and capabilities of the national teams to make accurate, complete and timely uploads. In most cases, agencies will be using their own internal systems for day to day monitoring and management and so the upload represents an additional task for them, one that should be kept as straightforward as possible. The experience of ESS Round 9 was reassuringly positive with national teams mostly able and willing to meet the requirements as described below. The majority of National Coordinators (14 out of 18) reported using the uploaded data to help them monitor and discuss fieldwork with the survey agency. However, experiences in a few countries were less positive and highlight important issues to consider.
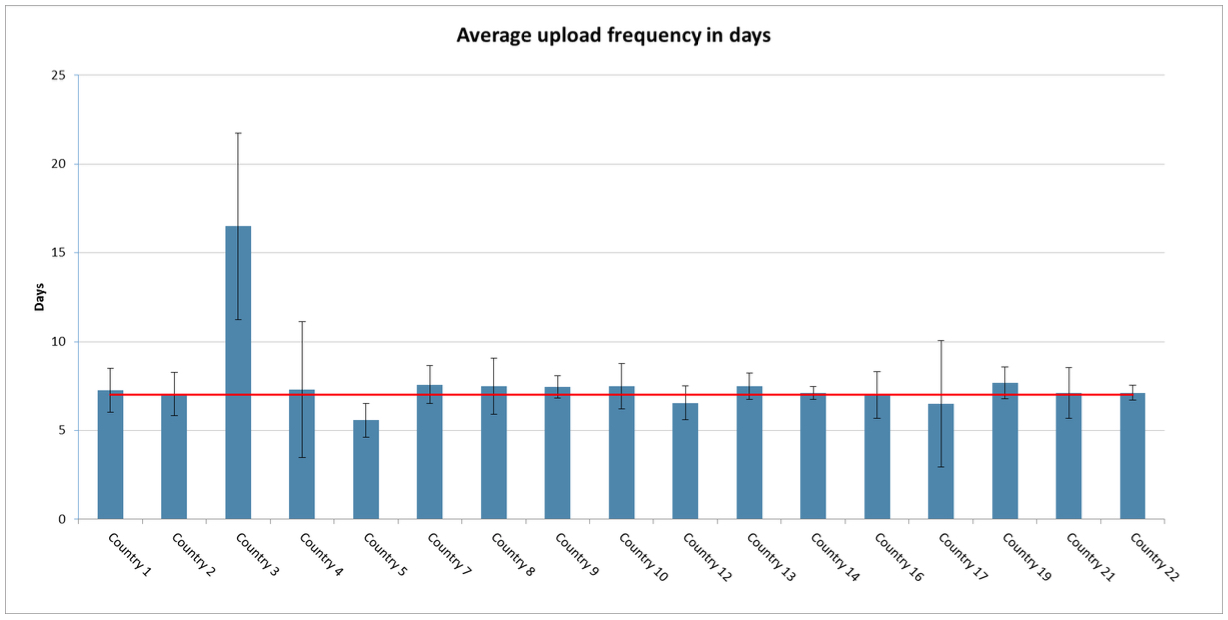
The data upload was usually performed by a dedicated person within the survey agency. In many countries, the agency was able to set up routines to automate the generation of the upload file from data stored within their internal systems and so the weekly upload was not burdensome. The semi-automated nature of the process is reflected in the fact that, for the most part, countries stuck to the pre-agreed upload schedule and uploaded files on the same day each week. The main gap in the upload schedule occurred over the Christmas period when staff members were not around to make the upload.
Figure 7. Mean upload frequency for FMS Upload Portal in days (including ±1 standard deviation) – weekly upload average highlighted in red.
Furthermore, although a number of countries had some “teething problems” with their initial uploads, for example because dates had been entered in the wrong format, once the first upload had been completed there was little problem with subsequent uploads. In the majority of countries the data uploads appear to have provided an up to date picture of fieldwork, recording multiple contact attempts up to the day of upload.
The main barrier to the successful use of the upload occurred in a few countries still reliant on paper contact forms or where the electronic contact form was programmed in such a way that it only transmitted completed cases back to the agency. This meant that the agency itself did not have access to complete or up to date contact records with which to populate the upload. They were able to provide an accurate record of the number of completed interviews but not to report fully on unproductive cases still in the field. It is clear that the success of the upload portal relies on national survey agencies using a fully functional electronic contact form to collect and receive data during fieldwork.
There was also some negative feedback on the upload process from agencies who resented having to provide monitoring information to the central team and felt that, as the survey experts, they should rather be left to get on with fieldwork. However, this view was expressed by only two countries and probably reflects attitudes towards the principle of central monitoring in general rather than the upload portal in particular. This feedback does though point to the fact that the process of and requirements for shared monitoring between national and central teams requires careful consideration to ensure that all partners are clear on the rational for the requirements and their particular role in the process.
4.4 Documenting fieldwork
Survey quality assurance and assessment of course relies not just on the active monitoring of fieldwork whilst it is taking place, but also the comprehensive and careful documentation of fieldwork processes to demonstrate compliance provide a point of reference for data users and allow for quality improvements in future data collection. The introduction of the FMS by the ESS was driven by a demand for more effective monitoring during fieldwork rather than the need for documentation. The latter requirement was already met by countries completing and making available (at the end of fieldwork) standardised Contact Form records detailing the timing, mode and outcome of contact attempts for all sample units ( European Social Survey, 2018). These Contact Form records remain the basis for the FMS and, at least, for countries using the Upload Portal the process of collecting, processing and documenting the contact form data remains unchanged, relying as it does on national survey agencies to coordinate. Nevertheless, there are some potential advantages for fieldwork documentation to be gained from the FMS.
First and foremost, especially for surveys which do not otherwise document their fieldwork, CASE CTRL provides a straightforward was to collect standardised contact information via an easy to use centrally-programmed mobile app. These data are then automatically available for retrieval by the survey agency as a case-level .CSV file. Feedback from early pilot testing of the app suggests that interviewers find the app easy to use compared, for example, with paper records which lack automatic routing (Butt & Watson, 2018). Nevertheless, careful training and briefing of interviewers in how to complete the contact form remains important.
Second, documenting a full picture of fieldwork requires not just the quantitative data usually supplied by contact form records but also qualitative feedback, for example to provide explanations as to why the fieldwork trajectory may be falling behind expectations. The FMS can be programmed to provide space for interviewers and/or survey agencies to record qualitative feedback. A record of this qualitative feedback is then available and more easily accessible than may be the case if such feedback were provided more informally or in a variety of modes.
Finally, any documentation of fieldwork is only as good as the quality of the data input. Having access to and discussing the Contact Form data in “real time” provides additional insights into the data collection process and suggests scope for improvement. For example, there was evidence that some interviewers were repeatedly selecting the wrong outcome codes, using the “other” code incorrectly. Flagging such errors can ensure that they are corrected in the data documentation for the current round and that the briefing given to interviewers in how to use certain codes is improved in the next round of data collection.
5. Discussion and Conclusion
A prerequisite for effective fieldwork monitoring is finding a way of managing the available fieldwork data effectively. This task can be especially complex for cross-national surveys dealing with multiple actors operating in different contexts. A particular challenge arises for surveys adopting a hybrid approach towards fieldwork monitoring, sharing responsibility for monitoring between central and local teams to try and balance the need for common quality standards whilst remaining sensitive to local context. This article demonstrates how a new electronic Fieldwork Management System, as adopted by ESS in Round 9, has helped to overcome the challenges associated with such a hybrid approach to monitoring cross-national fieldwork .
The FMS has facilitated improved insights by increasing the comprehensiveness, timeliness, consistency and accessibility of monitoring fieldwork data available during fieldwork. Access to multiple indicators at different levels of aggregation (regional, population sub-group, interviewer) generate better-informed assessment of the situation of the survey in the field and facilitate discussion of possible strategies to improve fieldwork. Having fieldwork data available at least weekly and sometimes daily ensures that interventions can be made whilst they are still relevant. Calculating monitoring indicators centrally increases their consistency and comparability across countries whilst the sharing of fieldwork data via a common online interface facilitates data access and improved communication across stakeholders.
Drawing on examples from the experience of monitoring fieldwork in 22 countries simultaneously during ESS Round 9, the article showcases how the improved FMS fieldwork data has been instrumental in providing two things: First, a better overview of the state of fieldwork and the means of comparing fieldwork progress and adherence to quality standards across countries. Second, a more detailed insight into the particular fieldwork dynamics within individual countries. These are necessary steps for improving the quality of the realised samples from a cross-national perspective. They provide the basis for identifying potential problems or limitations of the fieldwork strategies applied during the data collection and can help design strategies for improvement through targeted interventions (e.g. responsive or adaptive survey designs) and reducing errors that may affect comparability.
Crucially, the ESS’ experience with the FMS demonstrates that there is more than one way to realise the benefits of improved fieldwork data management. One possibility, but not the only one, is to follow the approach previously developed by SHARE and implement a single data collection tool such as CASE CTRL across countries. Alternatively, it is possible to achieve many of the benefits of CASE CTRL with a more decentralised approach; allowing countries to upload data collected using their own in house tools to a shared online portal in order to generate standardised indicators. This route may serve to bring the prospect of effective central control within reach of more cross-national surveys and a wider number of participating countries.
The choice between the different versions of the FMS – CASE CTRL or the Upload Portal – does involve trade-offs. From a fieldwork monitoring perspective, the data available via the Upload Portal is less detailed and less frequently updated (weekly rather than daily) than the information provided via CASE CTRL as well as being more dependent on manual input from participating countries. From a survey management perspective, however, the Upload Portal can be adapted to different modes of data collection and utilise the data collection infrastructure already available in each country, thereby reducing implementation costs whilst still retaining data quality. ESS’ experience in Round 9 suggests that compliance with the requirements of the Upload Portal (making weekly uploads, adherence to a common data template) is sufficiently good to make this approach feasible.
As with any tool there is scope to improve on the FMS in future rounds. The outputs the FMS provides are only as good as the data inputs provided by interviewers, that is how thoroughly and consistently they complete the necessary contact information about each sample unit. The FMS has been instrumental in highlighting, in a timely manner, some ongoing inconsistencies across countries in how the contact forms are completed, for example regarding coding a case’s outcome status as “other” or the recording of non-face-to-face contact attempts. This suggests further instructions to survey agencies and interviewers may be beneficial. Moreover, drawing on insights gained during Round 9 about fieldwork patterns, it should be possible to implement routines to automatically flag potentially problematic cases, interviewers, or regions based on the FMS fieldwork data, thereby further increasing the timeliness and consistency of feedback provided to countries at reduced effort. Also, there is the possibility of combining the common CASE CTRL with a single CAPI programme (as SHARE currently do) thereby enabling the central monitoring of interview measurement quality using (substantive) survey data.
Shared responsibility for fieldwork between the national and central teams is important for realising high quality cross-national data collection in the hybrid approach. It allows for the pooling of knowledge (e.g., about local customs) and expertise and supports the maintenance of common standards whilst still ensuring the flexibility to respond to individual circumstances and optimise national performance. Tools such as the FMS which foster such a joint approach by facilitating shared access to relevant data across national and central stakeholders are therefore important.
Access to appropriate monitoring of fieldwork data during fieldwork goes only part way to addressing the challenges associated with cross-national data collection. Being able to identify potential areas for improvement is a necessary but not sufficient step towards implementing solutions to achieving high quality data that is functionally equivalent across countries via monitoring of fieldwork. Nevertheless it is a vital step.
Appendix
- Appendix A. FMS upload portal guidance
- Appendix B. FMS summary reporting indicators
- Appendix C. Screenshots of interfaces from the FMS online platform
References
- Beullens, K., Loosveldt, G., Denies, K., & Vandenplas, C. (2016). Quality Matrix for the European Social Survey, Round 7 [Tech. Rep.]. Retrieved from European Social Survey ERIC, KU Leuven website: http://www.europeansocialsurvey.org/docs/round7/methods/ESS7_quality_matrix.pdf
- Biemer, P. P. (2010). Total Survey Error: Design, Implementation, and Evaluation. Public Opinion Quarterly, 74(5), 817–848. https://doi.org/10.1093/poq/nfq058
- Biemer, P. P., & Lyberg, L. E. (2003). Introduction to Survey Quality. John Wiley & Sons.
- Butt, S., Sommer, E., & Kuijten, L. (2016). Fieldwork Management and Monitoring System (FMMS) for the European Social Survey: Report on the feasibility of cross-national implementation. Retrieved from Funded under the European Union’s Horizon 2020 research and innovation programme GA No: 654221 website: Available at: www.seriss.eu/resources/deliverables
- Butt, S., & Watson, L. (2018). European Social Survey Fieldwork Management and Monitoring System (FMMS): ESS Round 9 Pilot Evaluation report [Tech. Rep.]. London: European Social Survey ERIC.
- European Social Survey. (2015). Round 8 Survey Specification for ESS ERIC Member, Observer and Guest Countries [Tech. Rep.]. Retrieved from Centre for Comparative Social Surveys, City University London website: https://www.europeansocialsurvey.org/docs/round8/methods/ESS8_project_specification.pdf
- European Social Survey. (2017). Round 9 Survey Specification for ESS ERIC Member, Observer and Guest Countries [Tech. Rep.]. Retrieved from Centre for Comparative Social Surveys, City University London website: https://www.europeansocialsurvey.org/docs/round9/methods/ESS9_project_specification.pdf
- European Social Survey. (2018). European Social Survey Round 8: Integrated Data from Contact Forms Edition 3.0 (Data File No. ESS8CFe03). Norway: Norwegian Social Science Data Services.
- Groves, R. M., & Heeringa, S. G. (2006). Responsive design for household surveys: Tools for actively controlling survey errors and costs. Journal of the Royal Statistical Society: Series A (Statistics in Society), 169(3), 439–457. https://doi.org/10.1111/j.1467-985X.2006.00423.x
- Groves, R. M., & Lyberg, L. (2010). Total Survey Error: Past, Present, and Future. Public Opinion Quarterly, 74(5), 849–879. https://doi.org/10.1093/poq/nfq065
- ISSP Research Group. (2018). International Social Survey Programme: Working Principals. Retrieved from http://www.issp.org/about-issp/organisation/
- Jowell, R., Roberts, C., Fitzgerald, R., & Eva, G. (2007). Measuring Attitudes Cross-Nationally: Lessons from the European Social Survey. SAGE.
- Koch, A. (2018). Assessment of socio-demographic sample composition in ESS Round 7 (p. 42). Mannheim: European Social Survey, GESIS.
- Malter, F. (2014). Fieldwork Monitoring in the Survey of Health, Ageing and Retirement in Europe (SHARE). Survey Methods: Insights from the Field (SMIF). Retrieved from https://surveyinsights.org/?p=1974
- Pennell, B.-E., Hibben, K. C., Lyberg, L. E., Mohler, P. Ph., & Worku, G. (2017). A Total Survey Error Perspective on Surveys in Multinational, Multiregional, and Multicultural Contexts. In P. P. Biemer, E. de Leeuw, S. Eckman, B. Edwards, F. Kreuter, L. E. Lyberg, … B. T. West (Eds.), Total Survey Error in Practice (pp. 179–201). https://doi.org/10.1002/9781119041702.ch9
- Schouten, B., Bethlehem, J., Beullens, K., Kleven, Ø., Loosveldt, G., Luiten, A., … Skinner, C. (2012). Evaluating, Comparing, Monitoring, and Improving Representativeness of Survey Response Through R-Indicators and Partial R-Indicators. International Statistical Review / Revue Internationale de Statistique, 80(3), 382–399.
- Smith, T. W. (2011). Refining the Total Survey Error Perspective. International Journal of Public Opinion Research, 23(4), 464–484. https://doi.org/10.1093/ijpor/edq052
- Vandenplas, C., Loosveldt, G., & Beullens, K. (2017). Fieldwork Monitoring for the European Social Survey: An illustration with Belgium and the Czech Republic in Round 7. Journal of Official Statistics, 33(3), 659–686. https://doi.org/10.1515/jos-2017-0031
- Wagner, J. R. (2008). Adaptive Survey Design to Reduce Nonresponse Bias (Doctoral Thesis). University of Michigan.
- Winker, P., Menold, N., & Porst, R. (2013). Interviewers’ Deviations in Surveys: Impact, Reasons, Detection and Prevention (New edition). Frankfurt am Main: Peter Lang GmbH, Internationaler Verlag der Wissenschaften.
-
Keywords
calibration CATI coverage coverage bias cross-national surveys data linkage data quality European Social Survey experiment face-to-face face-to-face survey Facebook hard to reach populations incentives item nonresponse measurement measurement error mixed-mode surveys multitasking non-probability samples Nonresponse nonresponse bias nonresponse rates paradata PIAAC Probability sample probability samples QR codes rare populations response rate Satisficing social desirability Social media survey survey-taking climate survey data survey management survey methods Telephone survey telephone surveys total survey error unit nonresponse validity web survey Web surveys weighting
